Sales & Traffic Trends by Child ASIN: export and sync to Google Sheets
Follow each child ASIN over time with sessions, conversion, Buy Box share, ordered units, and sales in one Google Sheet.

What this report tells you
Choose Sales & Traffic Trends by Child ASIN in Hopted to compare product performance across days, weeks, or months. The report combines a product dimension with a time dimension, so you can see which products changed and when. It uses Amazon’s Data Kiosk sales and traffic data.
Useful columns to start with
- Report Date, Child ASIN, and Parent ASIN — Identify the product and reporting period.
- Sessions — Compare browser and mobile app visits to the product.
- Unit Session % — Review units ordered relative to sessions.
- Buy Box % — Track the share of page views where your offer was the Featured Offer.
- Units ordered and Ordered product sales — Compare demand and sales value alongside Currency.
For a first worksheet, include Report Date, Child ASIN, Parent ASIN, Sessions, Unit Session %, Buy Box %, Units ordered, Ordered product sales, and Currency. Keep the account and marketplace alongside them when comparing several stores. These fields let you follow a product without losing the period or money context.
How to export to Google Sheets
1. Connect your seller account
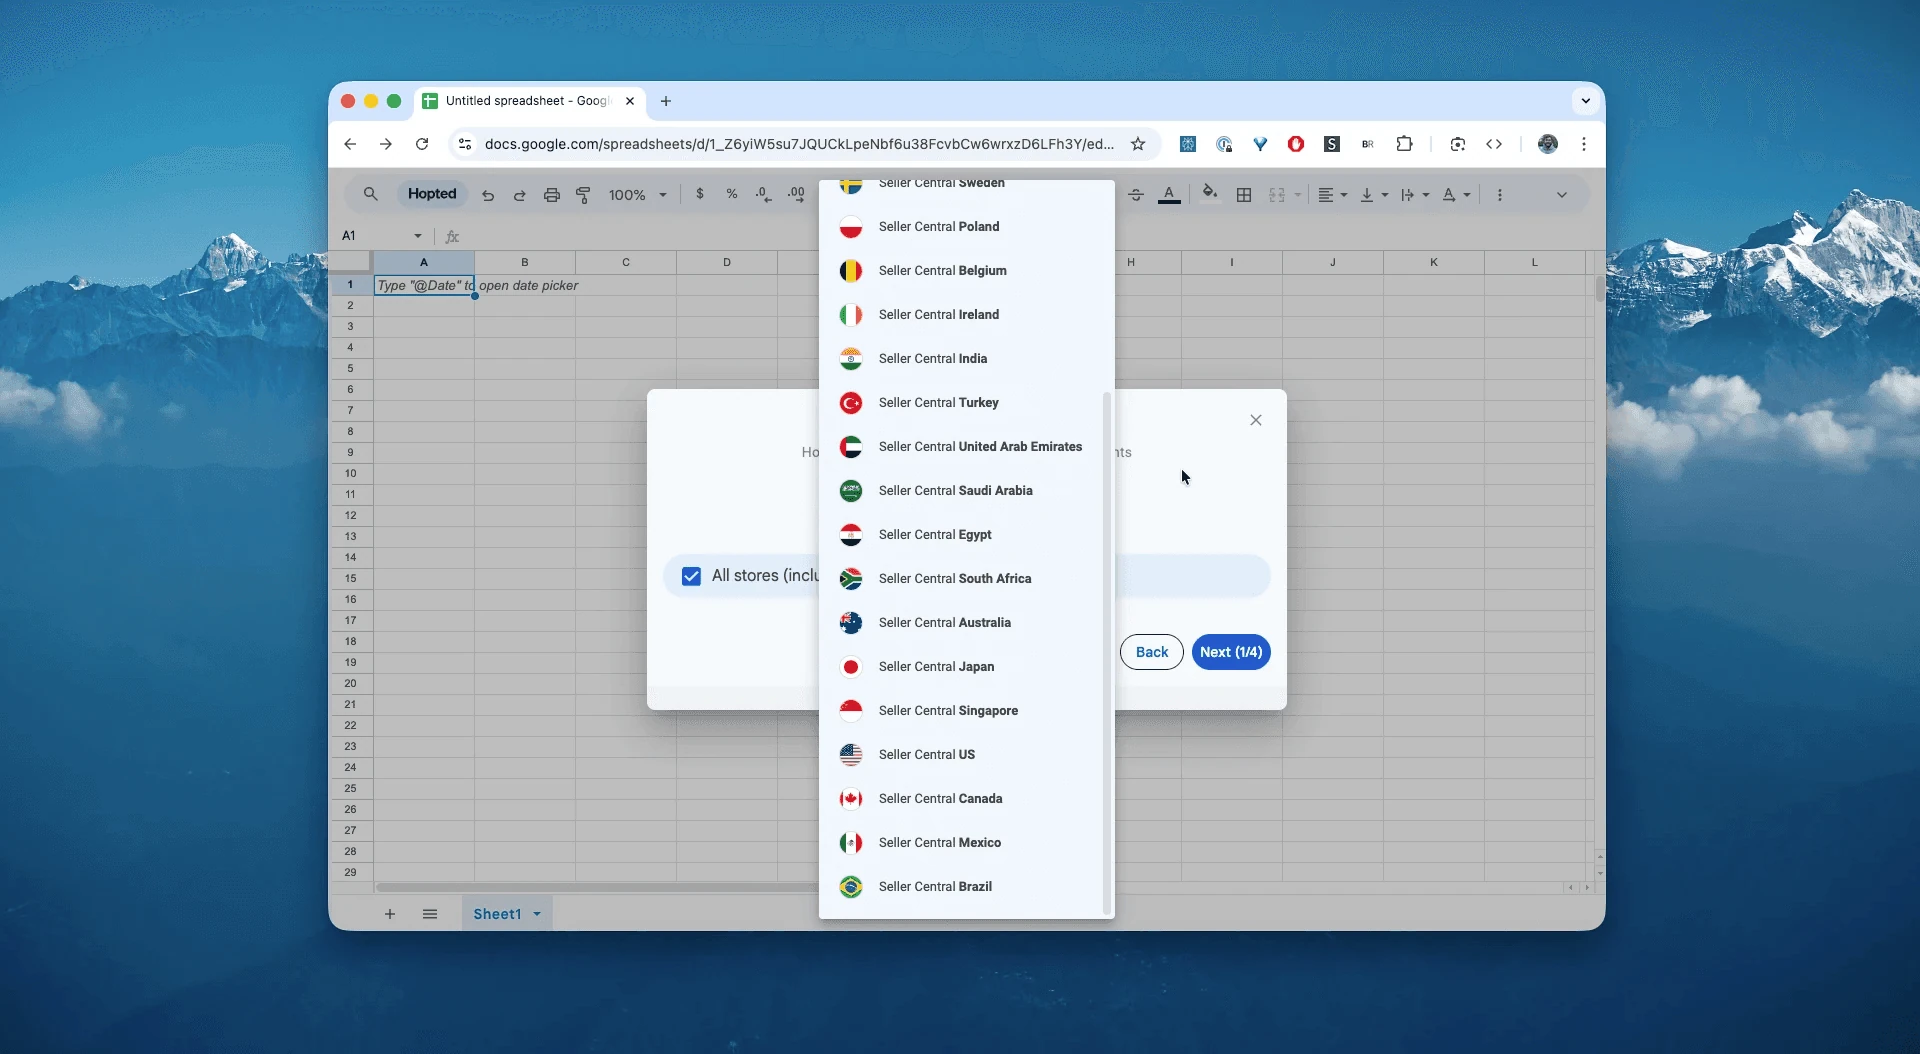
Open your Google Sheet, click Hopted, choose Add new data sync, then Amazon Seller Central and your seller accounts.
2. Choose the report and starting columns
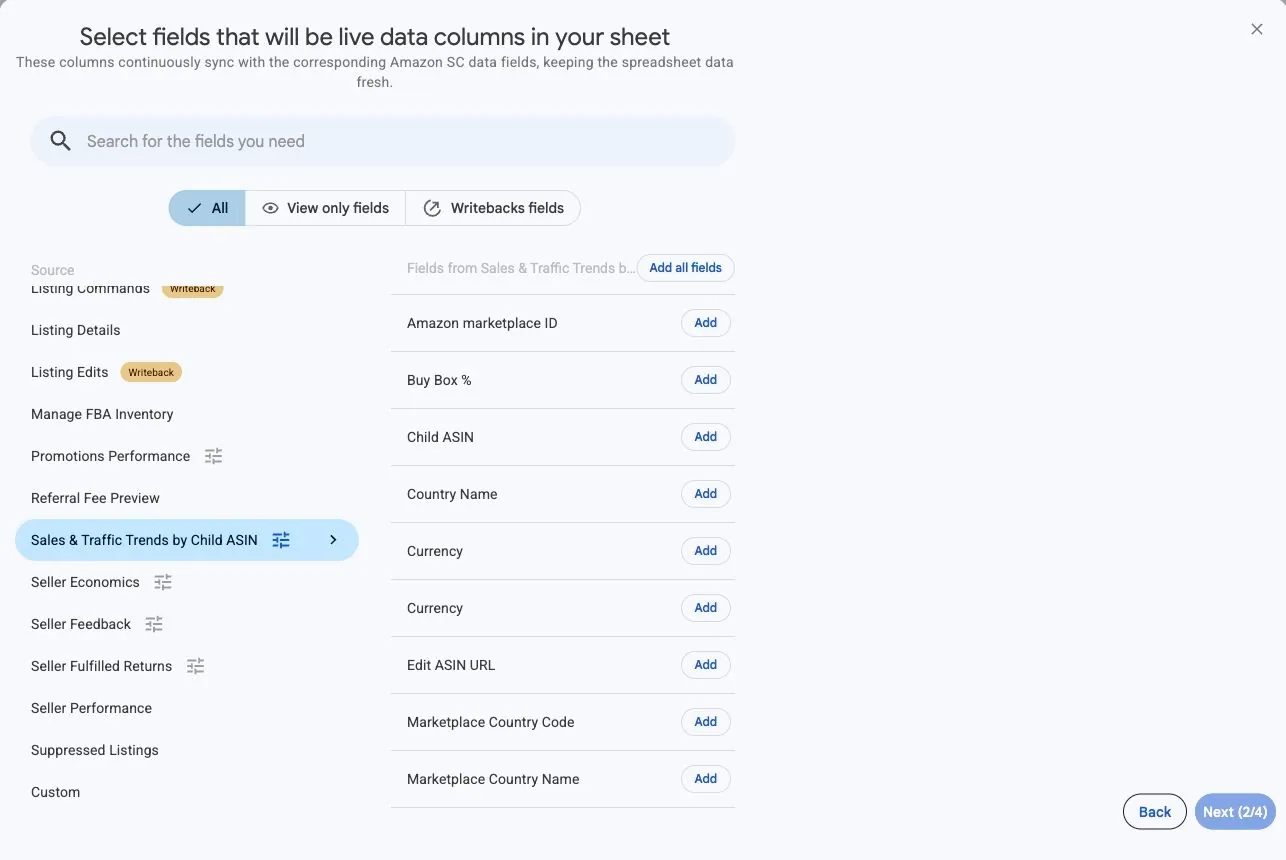
Choose Sales & Traffic Trends by Child ASIN from the available sources. Add the starting columns above. Keep both ordered units and sales: a revenue change can reflect a change in volume, selling price, or product mix.
3. Set the reporting range and grouping
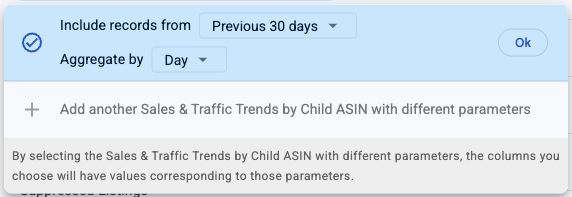
Select Sales & Traffic Trends by Child ASIN. Set Include records from and Aggregate by to Day, Week, or Month. A previous calendar month grouped by Day is a useful starting point.
Before switching to Week, choose a range containing at least one complete Sunday-to-Saturday week. Month needs at least one complete calendar month. The report uses the complete periods within your selected range. Keep that choice consistent when comparing two exports.
4. Review optional filters
Add the columns you need and review any optional filters. Keep product, marketplace, period, and currency fields with your metrics.
Start with a broad import while checking the setup. Once you recognize the expected products and periods, narrow the view for your task. If a result disappears, compare the source settings and filters before changing your analysis.
5. Choose a refresh schedule
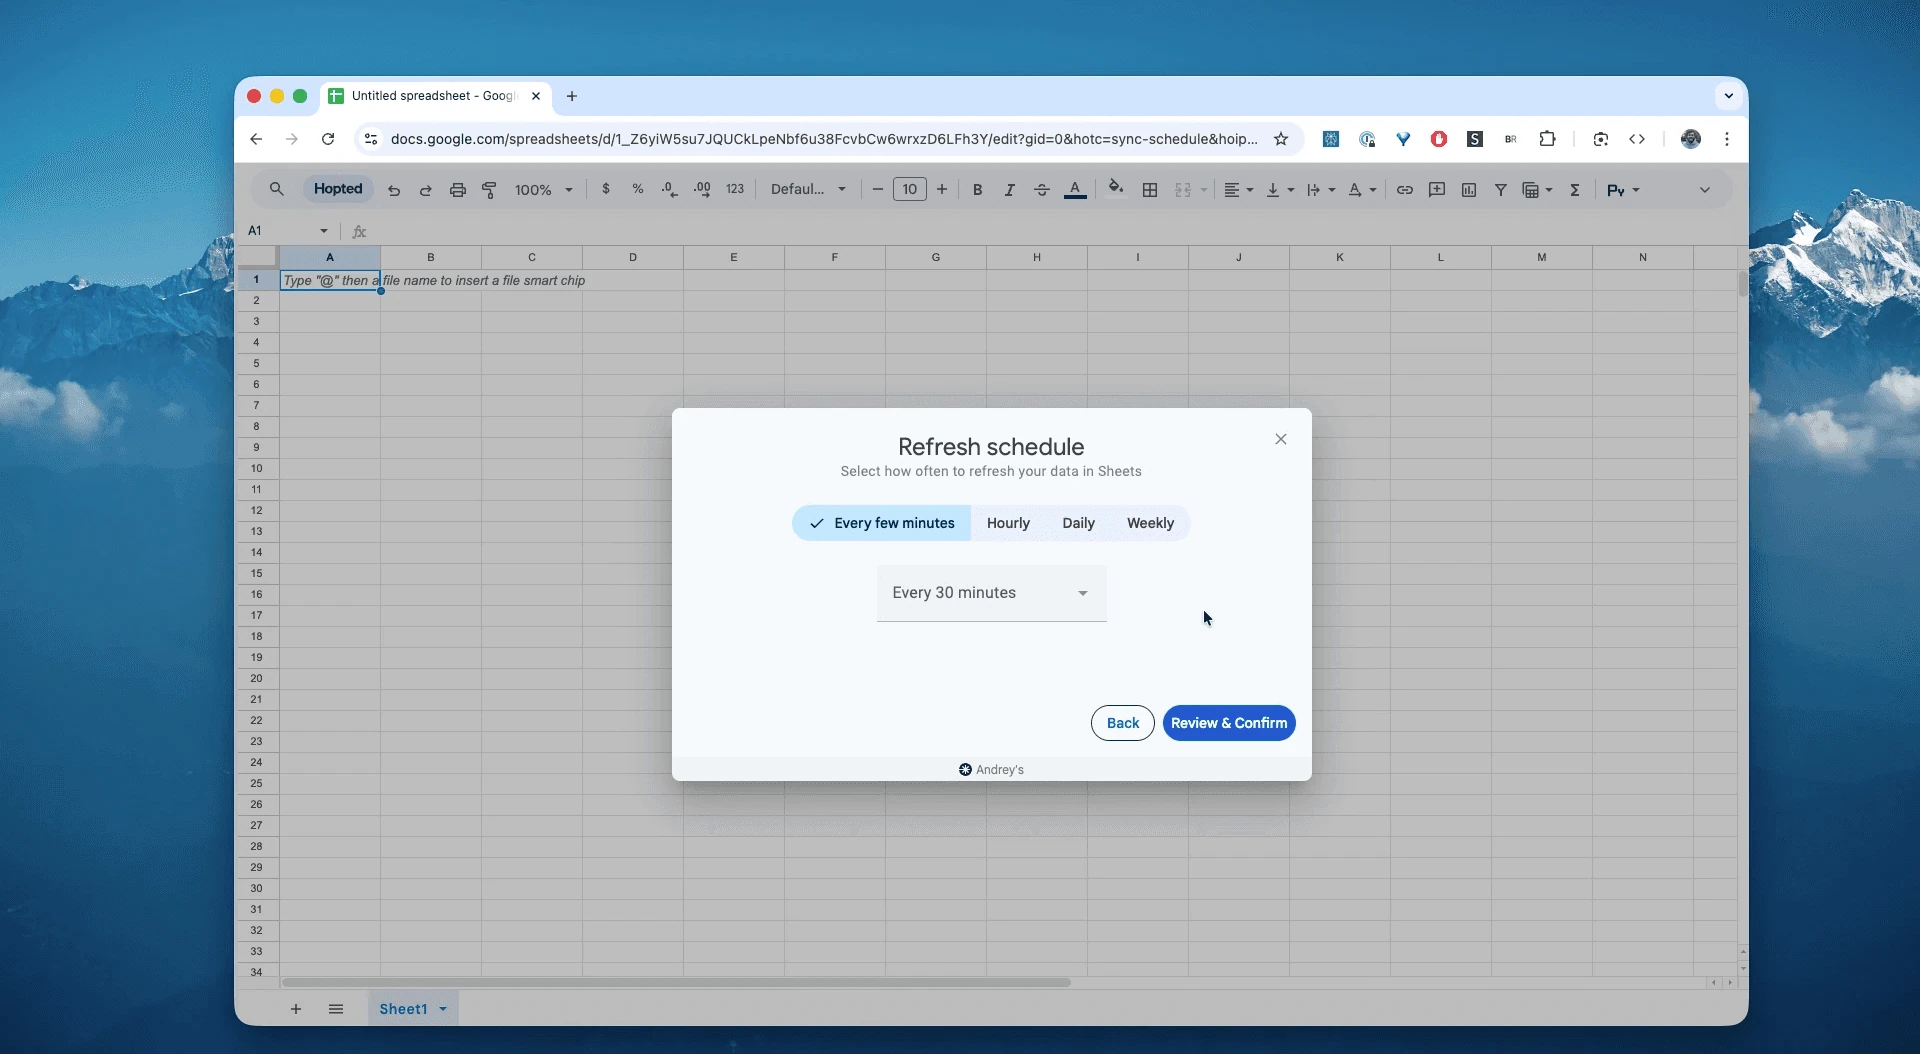
Choose a daily, weekly, or other available refresh schedule that fits your review. Check the time zone shown in Hopted. A scheduled refresh retrieves the data Amazon makes available; it does not shorten Amazon’s reporting delay.
6. Create the Sync and check the first rows
Review the accounts, selected columns, source settings, filters, and schedule, then select Create new Sync. Check the imported rows before building calculations.
After the first import, pick one child ASIN in one marketplace. Confirm the dates, currency, and reporting interval before comparing its numbers with Amazon. For a weekly row, Report Date identifies Sunday, not a single day’s activity. Check several rows before extending the workbook.
How to use the report
Start with a child ASIN whose sales changed. Compare Sessions, Unit Session %, and Buy Box % over matching periods. Fewer sessions suggest a different investigation from steady sessions and weaker conversion. These patterns help you choose what to check; they do not establish the cause.
1. Separate traffic changes from conversion changes
Compare one child ASIN in two matching weeks. If sessions fall from 1,000 to 800 while units stay at 100, units per session rise from 10% to 12.5%. Demand volume is steady despite lower traffic. If sessions stay at 1,000 while units fall to 80, investigate conversion instead. Then check pricing, availability, and the listing before deciding what changed.
2. Check Featured Offer changes alongside sales
Place Buy Box % beside Sessions and Units ordered. When Buy Box % drops while traffic stays similar, check your offer and competition for the affected products. A change in the same period is a reason to investigate, rather than proof that the Buy Box change explains every lost order. Compare the same child ASIN and marketplace.
3. Calculate an overall unit-session result
To combine unit-session performance, divide total Units ordered by total Sessions. A product with 10 units from 100 sessions and another with 10 from 50 sessions produce 20 units from 150 sessions, or about 13.33%. Averaging their 10% and 20% rates would give 15%, which weights the smaller traffic population too heavily.
What to check before comparing results
Use completed dates within the previous two years. Weekly rows cover complete Sunday-to-Saturday weeks; monthly rows cover complete calendar months. Report Date is the start of the period. Keep the same marketplace and currency when comparing sales.
Hopted omits rows when all tracked metrics and page views are explicitly zero. A missing row therefore needs context. Avoid summing percentage columns or taking a simple average across products with different traffic volumes.
Questions and answers
How is this different from Sales & Traffic by Child ASIN?
Sales & Traffic Trends adds a reporting date to each child ASIN, helping you compare the same product across days, weeks, or months.
Can this report show today’s results?
No. Hopted requires completed reporting dates for this source. A faster refresh schedule cannot make Amazon publish data sooner.
Why is a product or date missing?
Check the selected account, marketplace, date range, aggregation, and filters first. Hopted omits rows only when all tracked metrics and page views are explicitly zero. A missing row alone does not tell you why a product is absent or prove an import failure.
How should I read the percentage columns?
Unit Session % represents units ordered divided by sessions, expressed as a percentage. A value of 10 means 10%, not 0.10%. Buy Box % is based on page views where your offer was featured; it measures a different population. Do not add the two percentages together.
Sources
See the Amazon Seller Central connector for the connection overview, or return to the Seller Central reports directory.