SKU Economics: export and sync to Google Sheets
Review product sales, refunds, Amazon fees, advertising charges, seller-provided costs, and net proceeds in Google Sheets.
What this report tells you
Use SKU Economics (seller economics and unit economics) to review product economics at SKU, child ASIN, or parent ASIN level. Start with a product summary, then use separate fee or advertising views to investigate the charges behind it. This source imports Amazon’s reported figures for the grouping you choose.
Useful columns to start with
- Period start, Period end, product identifiers, and Currency — Keep the reporting context visible.
- Units ordered, Units refunded, and Net units sold — Compare sales volume with refunds.
- Ordered product sales, Refunded product sales, and Net product sales — Review the corresponding sales amounts.
- Cost of goods sold per unit — Check the product cost provided to Amazon by the seller.
- Net proceeds total and Net proceeds per unit — Review Amazon’s calculated proceeds with the costs it has available.
Begin with SKU, Period start, Period end, Units ordered, Units refunded, Net units sold, Ordered product sales, Refunded product sales, Net product sales, Net proceeds total, Net proceeds per unit, and Currency. Add seller-provided cost fields when reviewing cost completeness. A compact summary is easier to reconcile before introducing charge detail.
How to export to Google Sheets
1. Connect your seller account
Open your Google Sheet, click Hopted, choose Add new data sync, then Amazon Seller Central and your seller accounts.
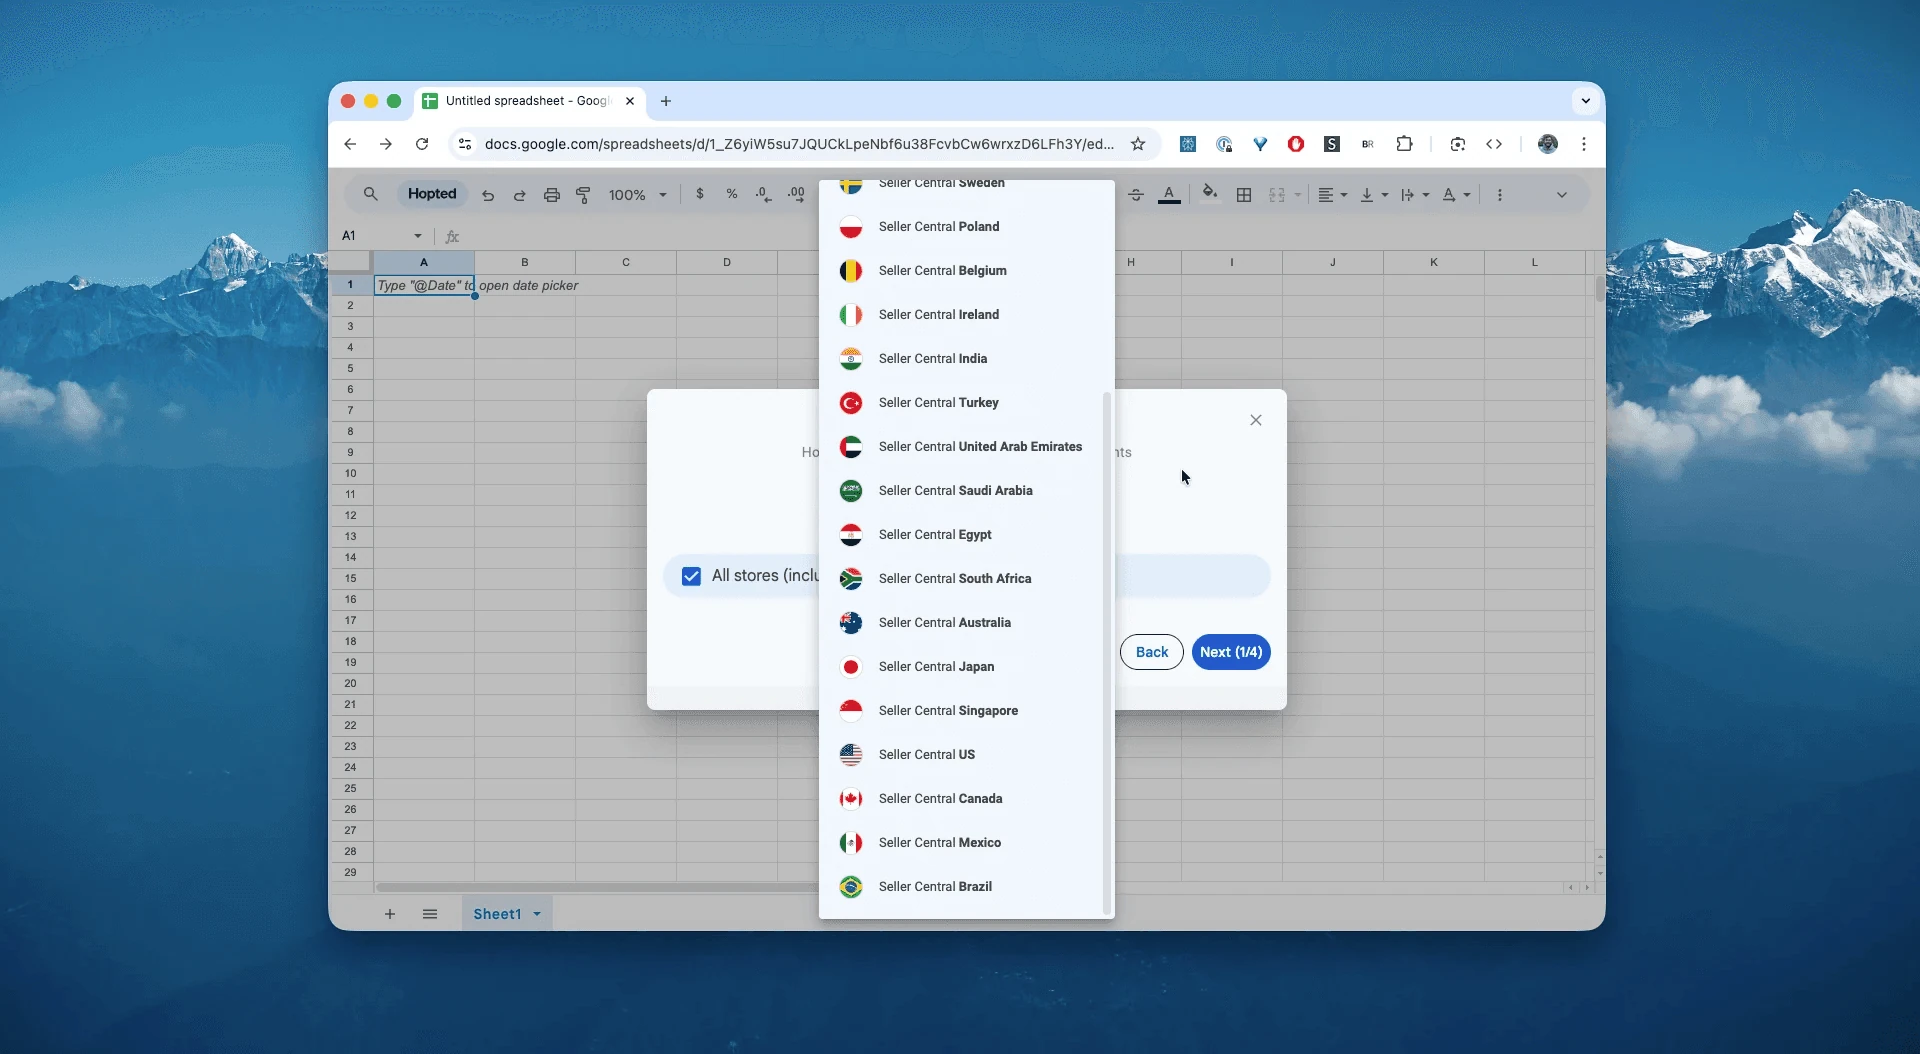
2. Choose the report and starting columns
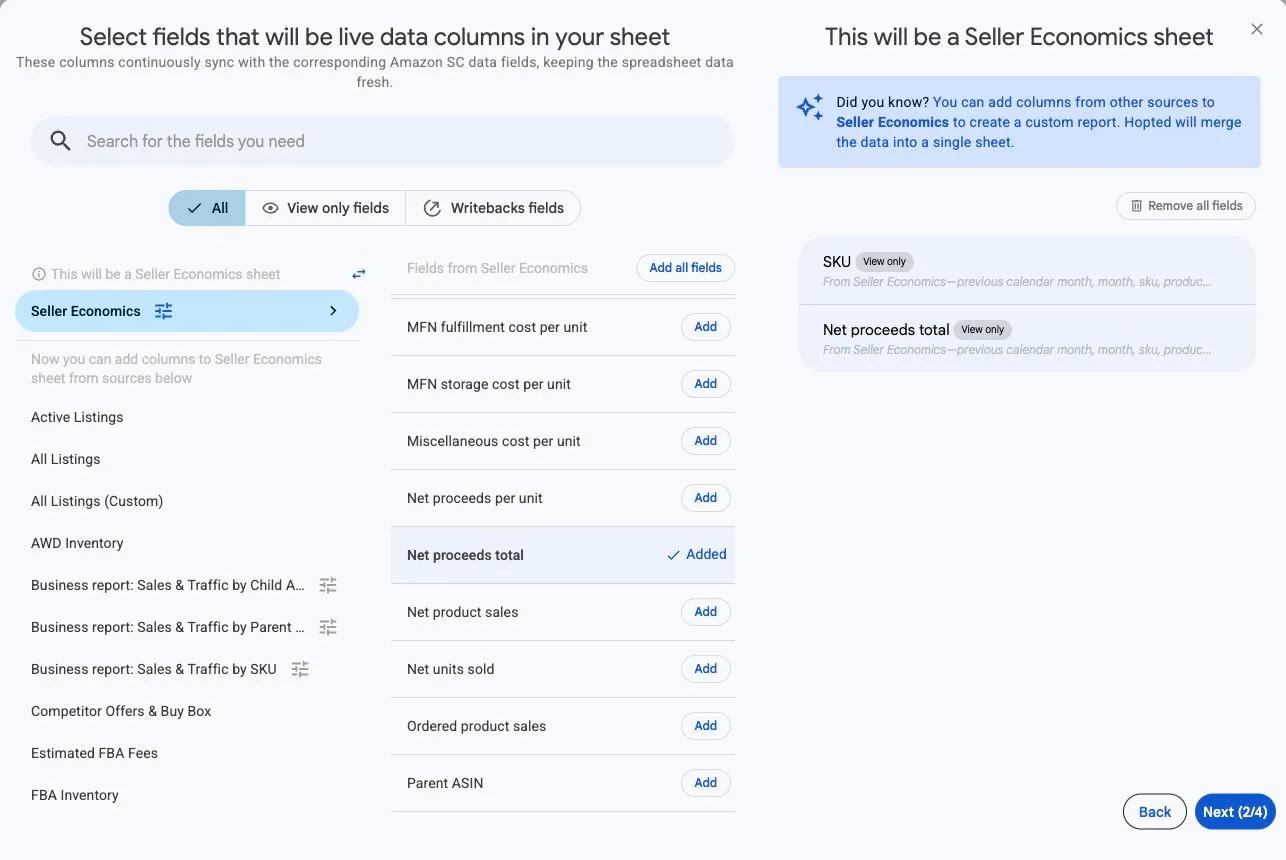
In Hopted’s source picker, choose Seller Economics to import the SKU Economics report, then add product-summary fields first. The source offers several kinds of rows, so decide whether the worksheet should contain product summaries, fee charges, fee components, or advertising charges before adding every available field.
3. Set the reporting range and grouping
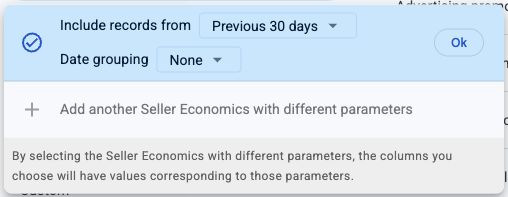
Open the source settings and set Include records from and Date grouping. Start by adding SKU and product-summary columns. Hopted determines the row grouping from your selected fields; if it asks what they relate to, choose the product level you need. Date grouping None returns the range together; Day, Week, and Month split it into periods.
For a first monthly review, choose Previous calendar month with Date grouping Month and add SKU with the summary metrics. Keep the same period and product level in a second charge-detail sync. Changing from SKU to Child ASIN or Parent ASIN changes Amazon’s requested grouping; do not assume it is a simple rearrangement of the same totals.
4. Review optional filters
Add the columns you need and review any optional filters. Keep product, marketplace, period, and currency fields with your metrics.
Start with a broad import while checking the setup. Once you recognize the expected products and periods, narrow the view for your task. If a result disappears, compare the source settings and filters before changing your analysis.
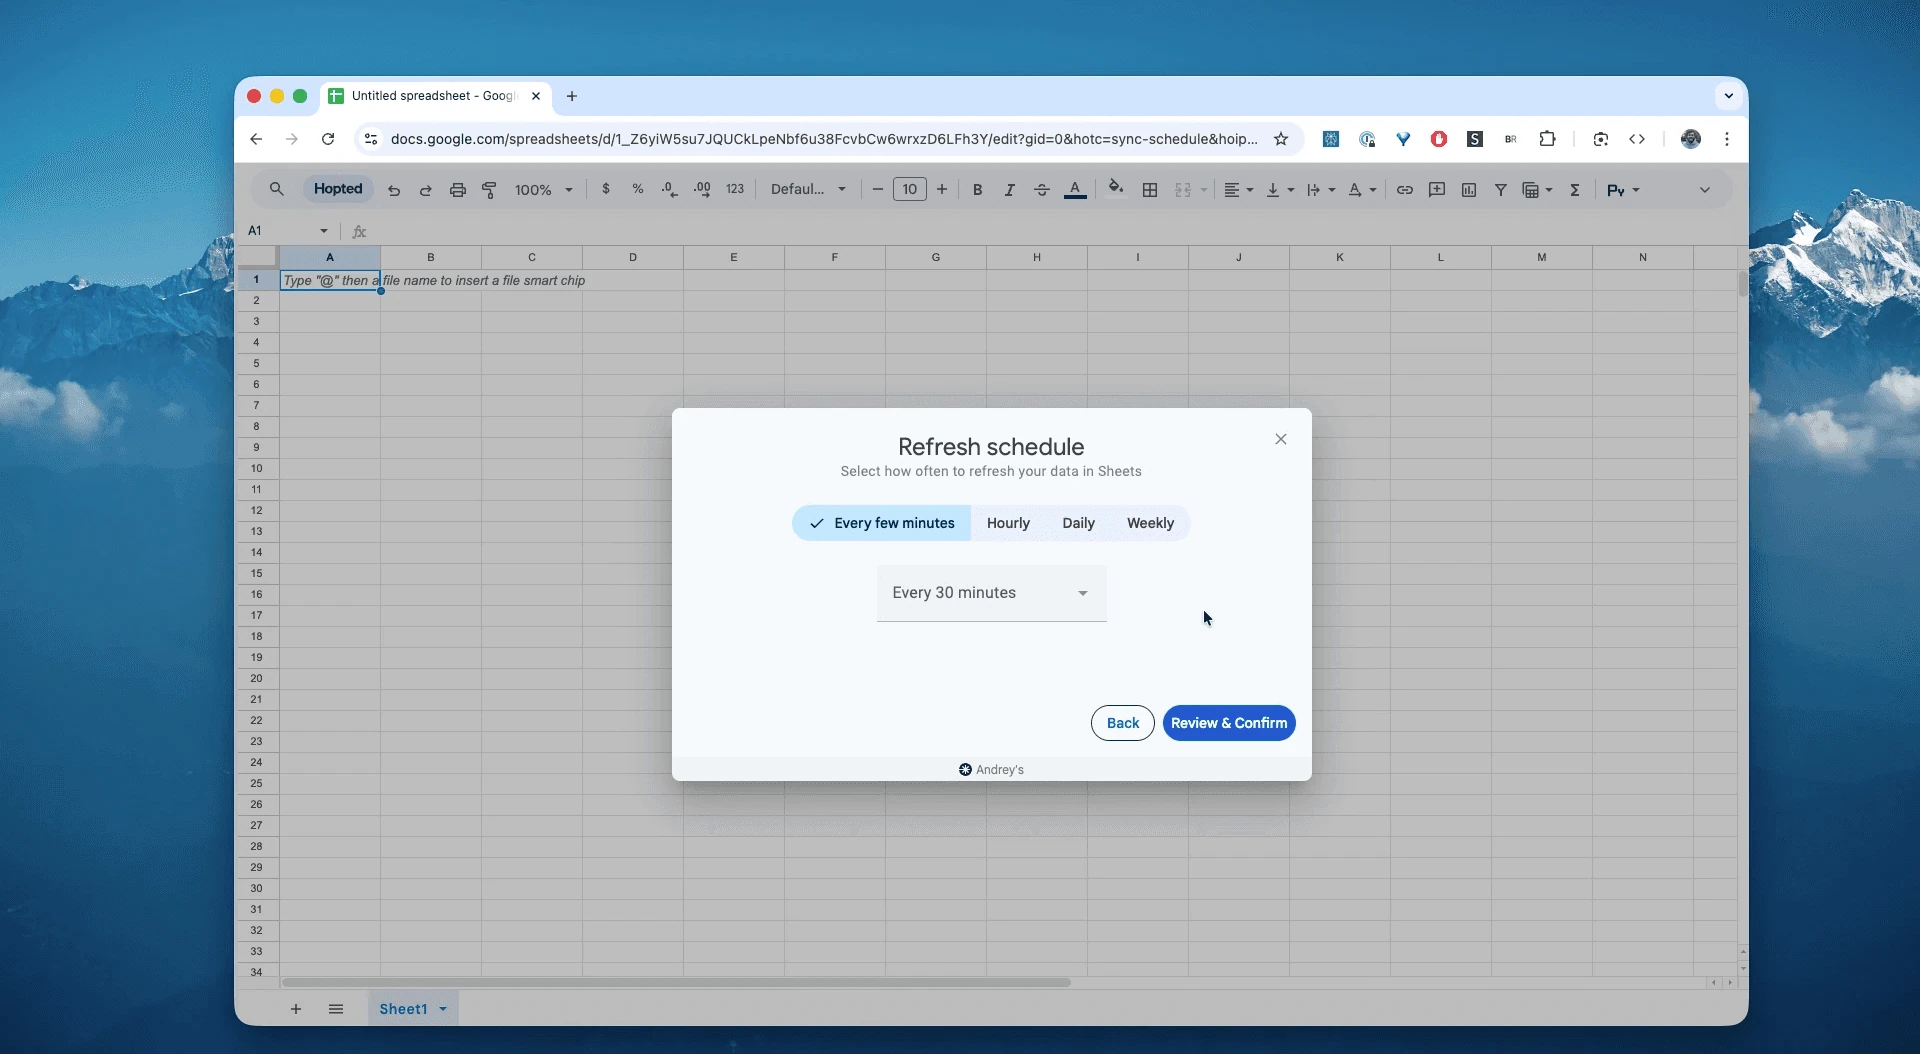
5. Choose a refresh schedule
Choose a daily, weekly, or other available refresh schedule that fits your review. Check the time zone shown in Hopted. A scheduled refresh retrieves the data Amazon makes available; it does not shorten Amazon’s reporting delay.
6. Create the Sync and check the first rows
Review the accounts, selected columns, source settings, filters, and schedule, then select Create new Sync. Check the imported rows before building calculations.
After the first import, choose one SKU and verify its period and currency. Compare ordered and refunded sales with net product sales, then inspect the cost fields that Amazon returned. Leave a missing cost visible while investigating it; silently replacing it with zero can overstate the economics you present.
How to use the report
Compare net proceeds across products to choose which ones need a closer cost review. For a charge breakdown, create another sync with the same product and date grouping and add the relevant fee-charge, fee-component, or advertising-charge columns. Compare totals at matching dimensions, keeping each detail view separate.
1. Separate sales growth from refunds
Read Units ordered and Units refunded together. With 100 units ordered and 10 refunded, Net units sold is 90. If ordered product sales are $2,000 and refunded product sales are $200, net product sales are $1,800. Keep the period visible: this comparison is an aggregate for that period, not an order-by-order match of purchases and later refunds.
2. Investigate a change in fees
Create a second worksheet with the same date and product grouping, then add fee-charge columns. Start with Fee type, Fee identifier, Fee period start, Fee period end, Fee total charge, and Currency. Compare the charge totals for the same products and periods. Use Fee component for a supported breakdown, and keep component totals separate from their parent charge to avoid counting the same cost twice.
3. Review net proceeds with cost completeness
If Net proceeds total is $450 across 90 net units sold, the corresponding amount is $5 per net unit. Check the seller-provided cost fields before using that result in a margin review. Add any remaining business expenses in your own calculation and identify which costs are already included, so you do not deduct them twice.
What to check before comparing results
Net proceeds is Amazon’s calculation with the costs it has available. Seller-provided costs may be missing; review those inputs and any remaining business costs before treating proceeds as final profit.
Amazon’s totals can differ between SKU, Child ASIN, and Parent ASIN. Keep the same grouping across comparisons. Use dates within the previous two years and complete weeks or months when choosing those periods. Do not add fee components to their parent charge totals or sum per-unit amounts.
Questions and answers
Does SKU Economics calculate my final profit?
It imports Amazon’s net proceeds, which may omit costs the seller has not provided. Check cost completeness and remaining business expenses before using it as final profit.
Why do available columns change as I add fields?
Product summaries, fee charges, fee components, and advertising charges describe different kinds of rows. Hopted uses your selected fields to determine their grouping and offers compatible columns. If the fields leave the grouping unclear, it asks you to choose what they relate to.
Why is a cost or fee detail blank?
Check the selected product and charge-detail fields first. Seller-provided costs can be missing when they have not been supplied to Amazon. Fee components are available for supported fee types rather than every charge. A blank value should prompt a check, not an automatic assumption of zero cost.
Can I add advertising and fee rows to product summaries?
Use them to investigate the amounts behind the summary. Keep their detail rows in separate views and compare matching product, period, marketplace, and currency. Product net proceeds already reflects Amazon’s calculation; subtracting the same imported charges again can count a cost twice.
Sources
See the Amazon Seller Central connector for the connection overview, or return to the Seller Central reports directory.