Your profit margin can be erased by one simple mistake: a wrong product dimension in Amazon's system. An item they measure as 1cm too long can jump to the next size tier, costing you extra on every single sale. The FBA Fee Preview Report is your only tool to catch these errors before they drain your bank account. This guide shows you how to stop reacting and start auditing. We'll cover how to automatically pull your FBA Fee Preview report directly into Google Sheets to build a live fee-auditing and profitability dashboard.

How to Automatically Sync & Import the FBA Fee Preview Report to Google Sheets (The Hopted Way)
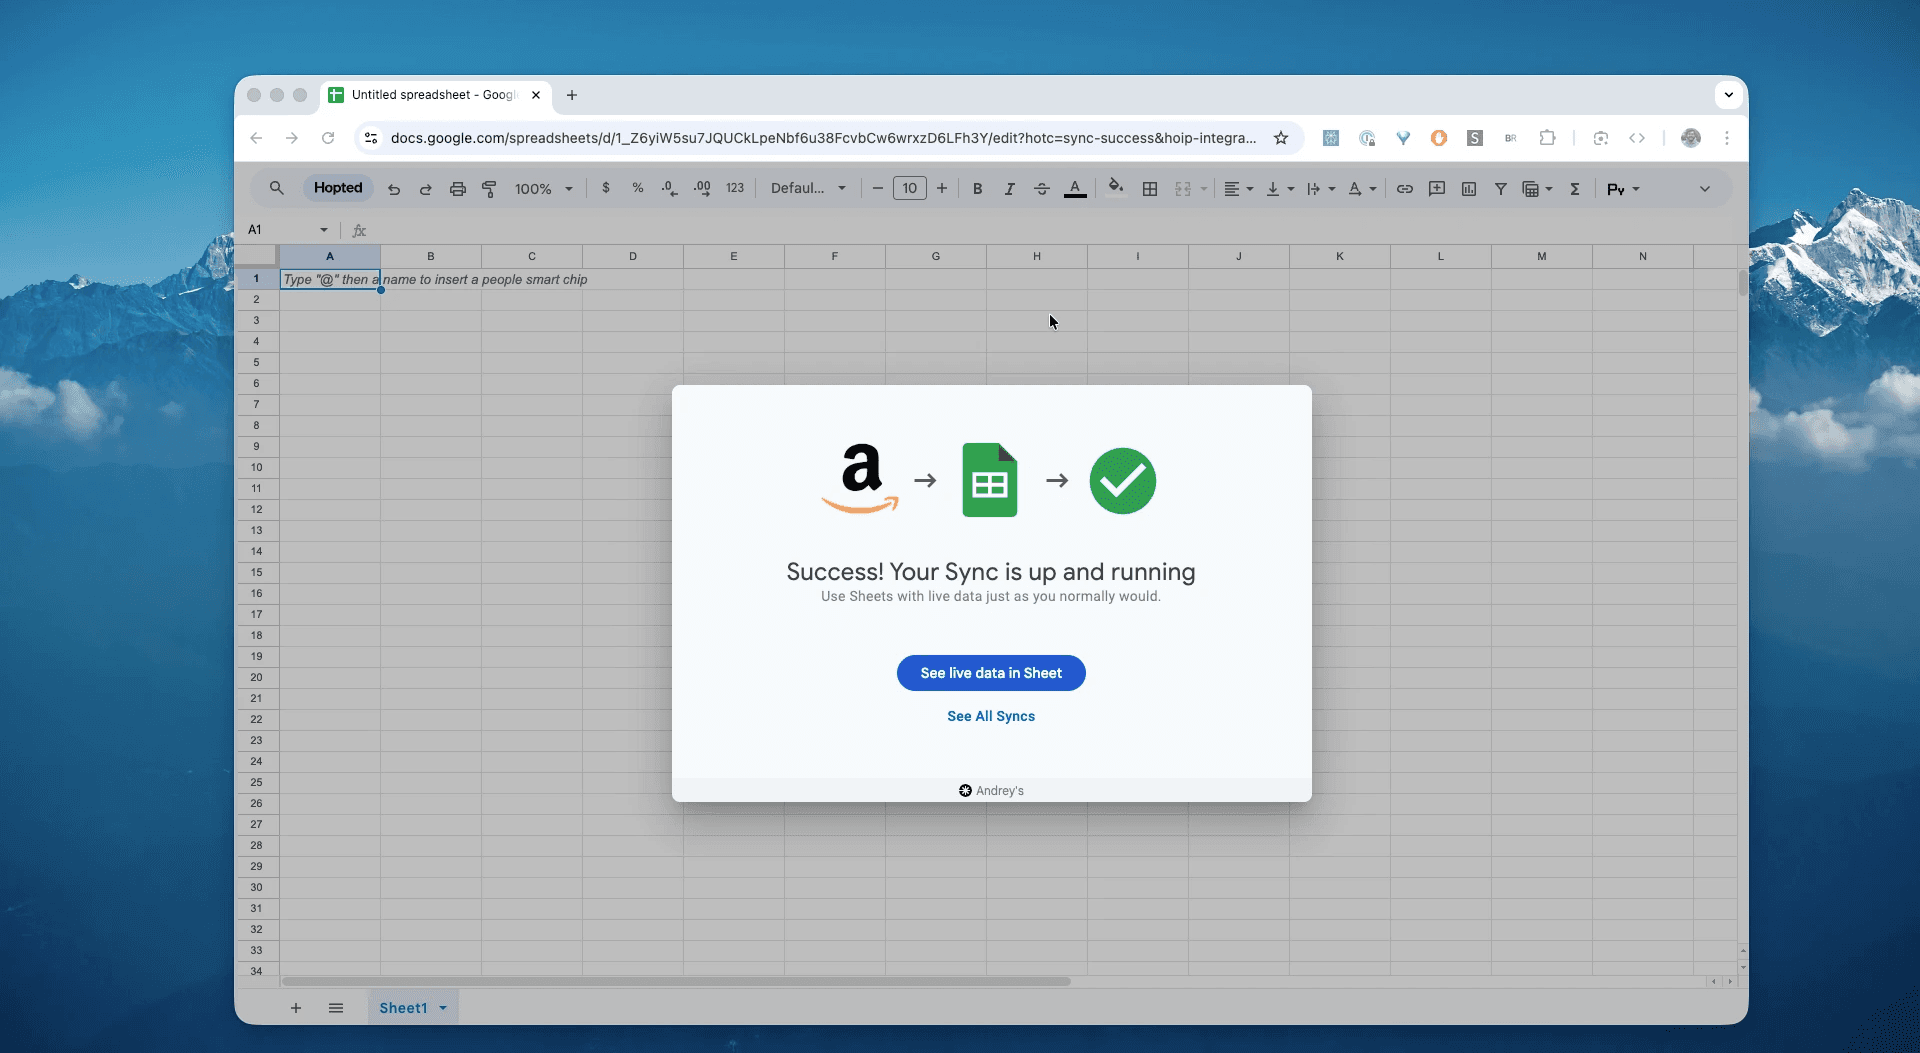
Using an Amazon to Google Sheets integration like Hopted, you set up the connection once, and your data flows automatically.
Step 1.
Install the Hopted browser extension and sign in using your Google Account.
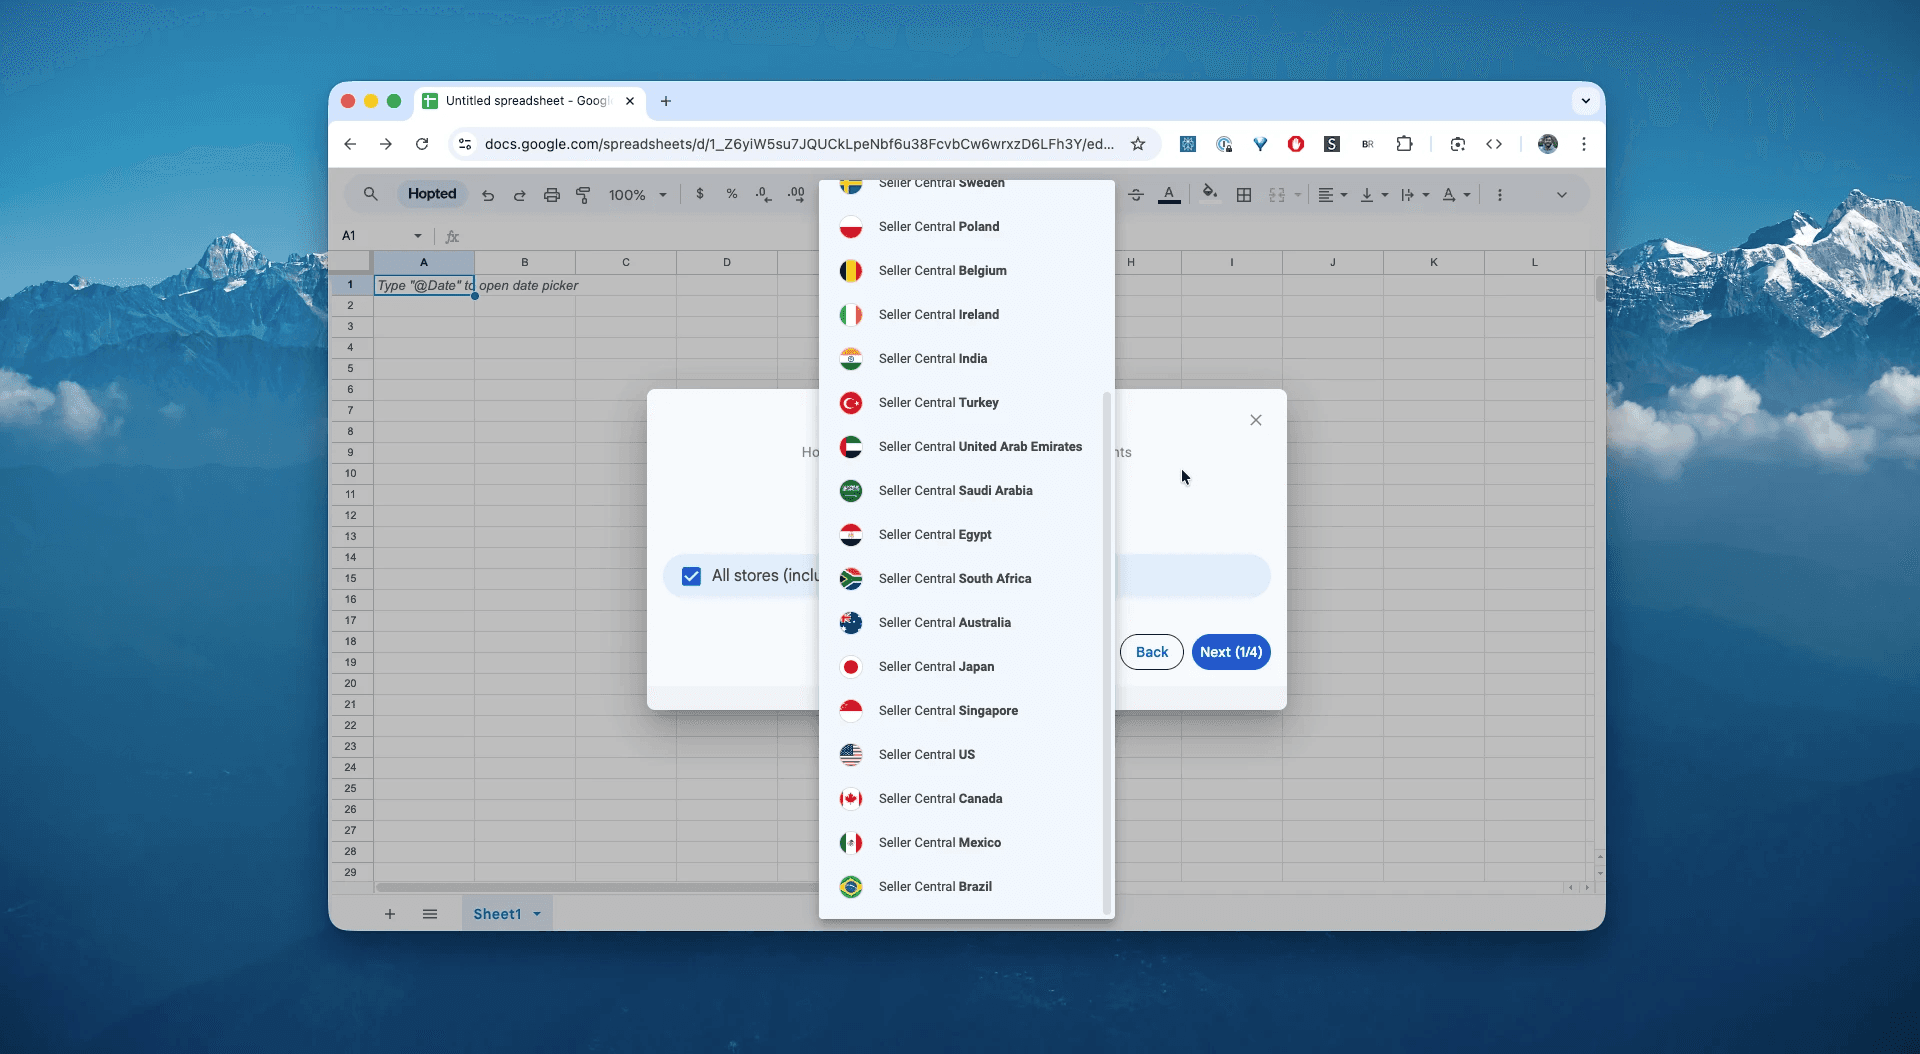
Step 2.
Securely connect your Amazon Seller Central to Google Sheets using Hopted's integration wizard.
Step 3.
In Google Sheets, from the list of available Amazon Seller Central reports, select "FBA Fee Preview".
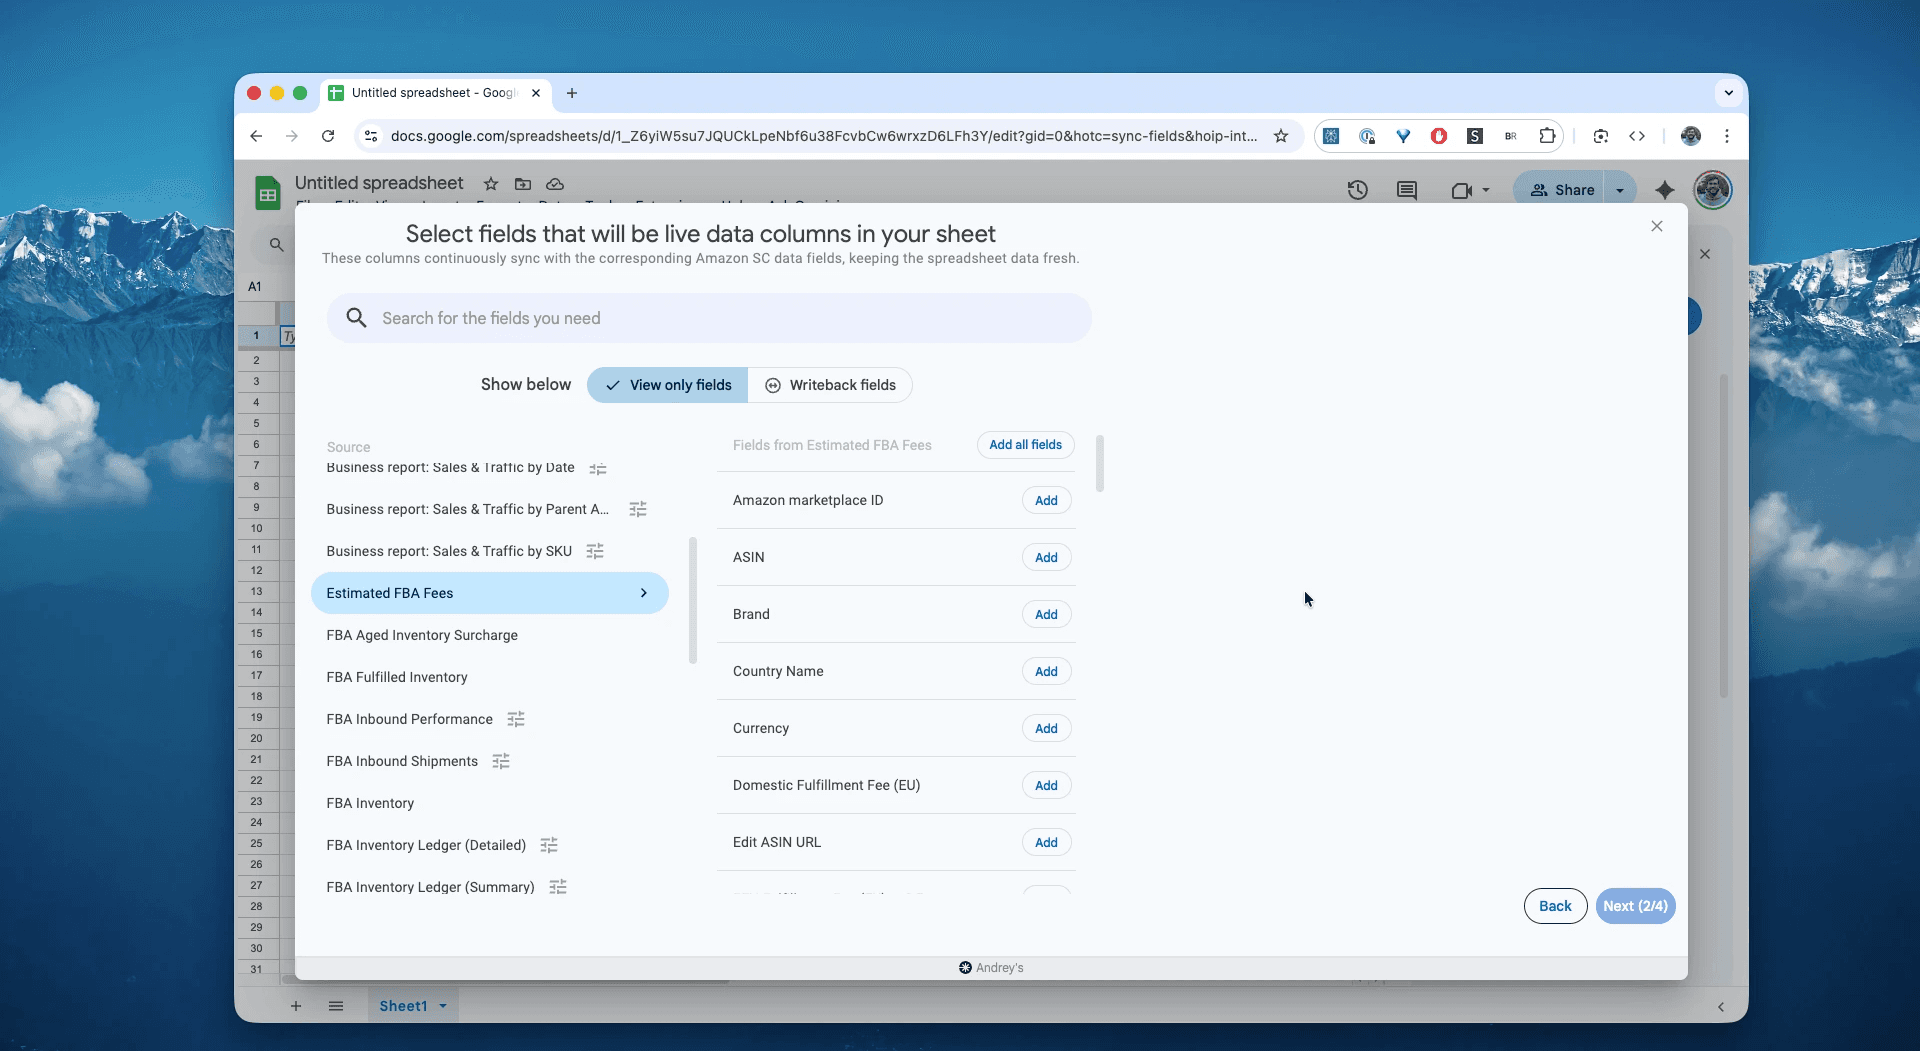
Step 4.
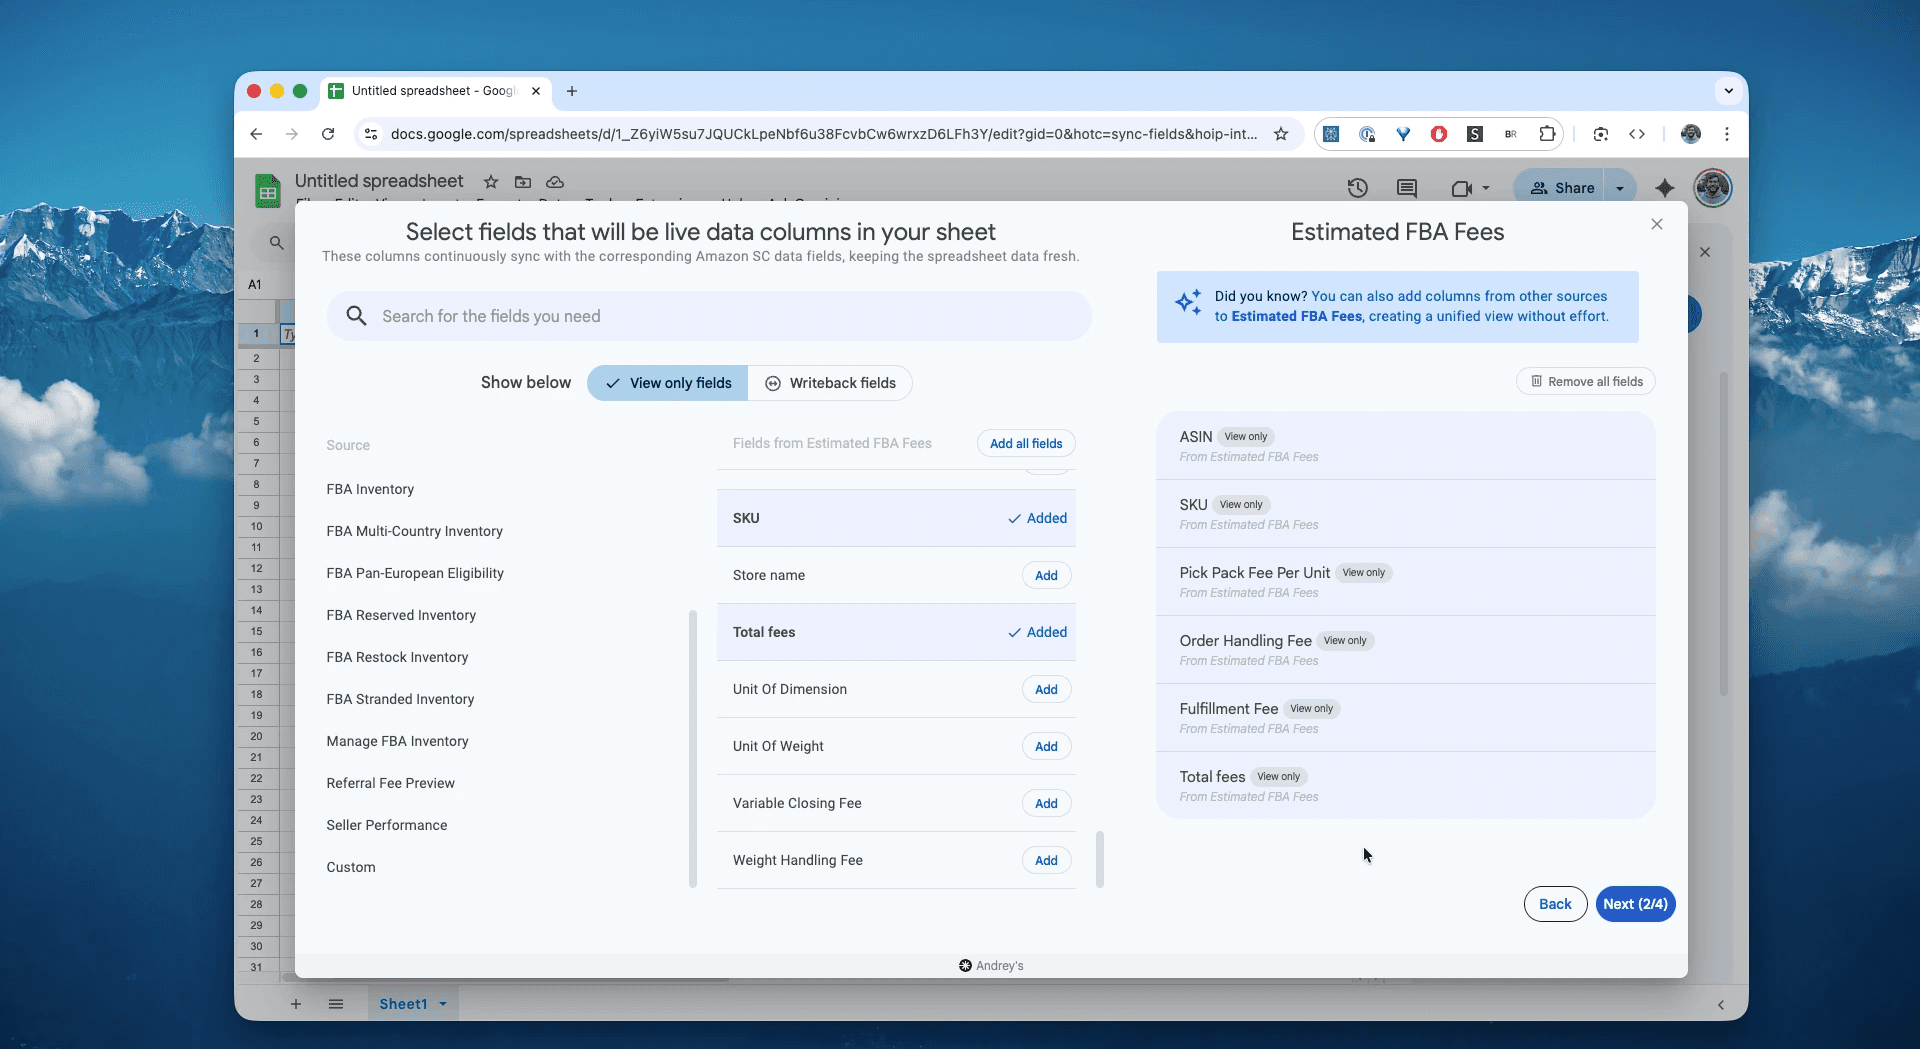
Select columns that you need: ASIN, SKU, pick and pack fee, handling fee, fulfillment fee, total fee and other fields.
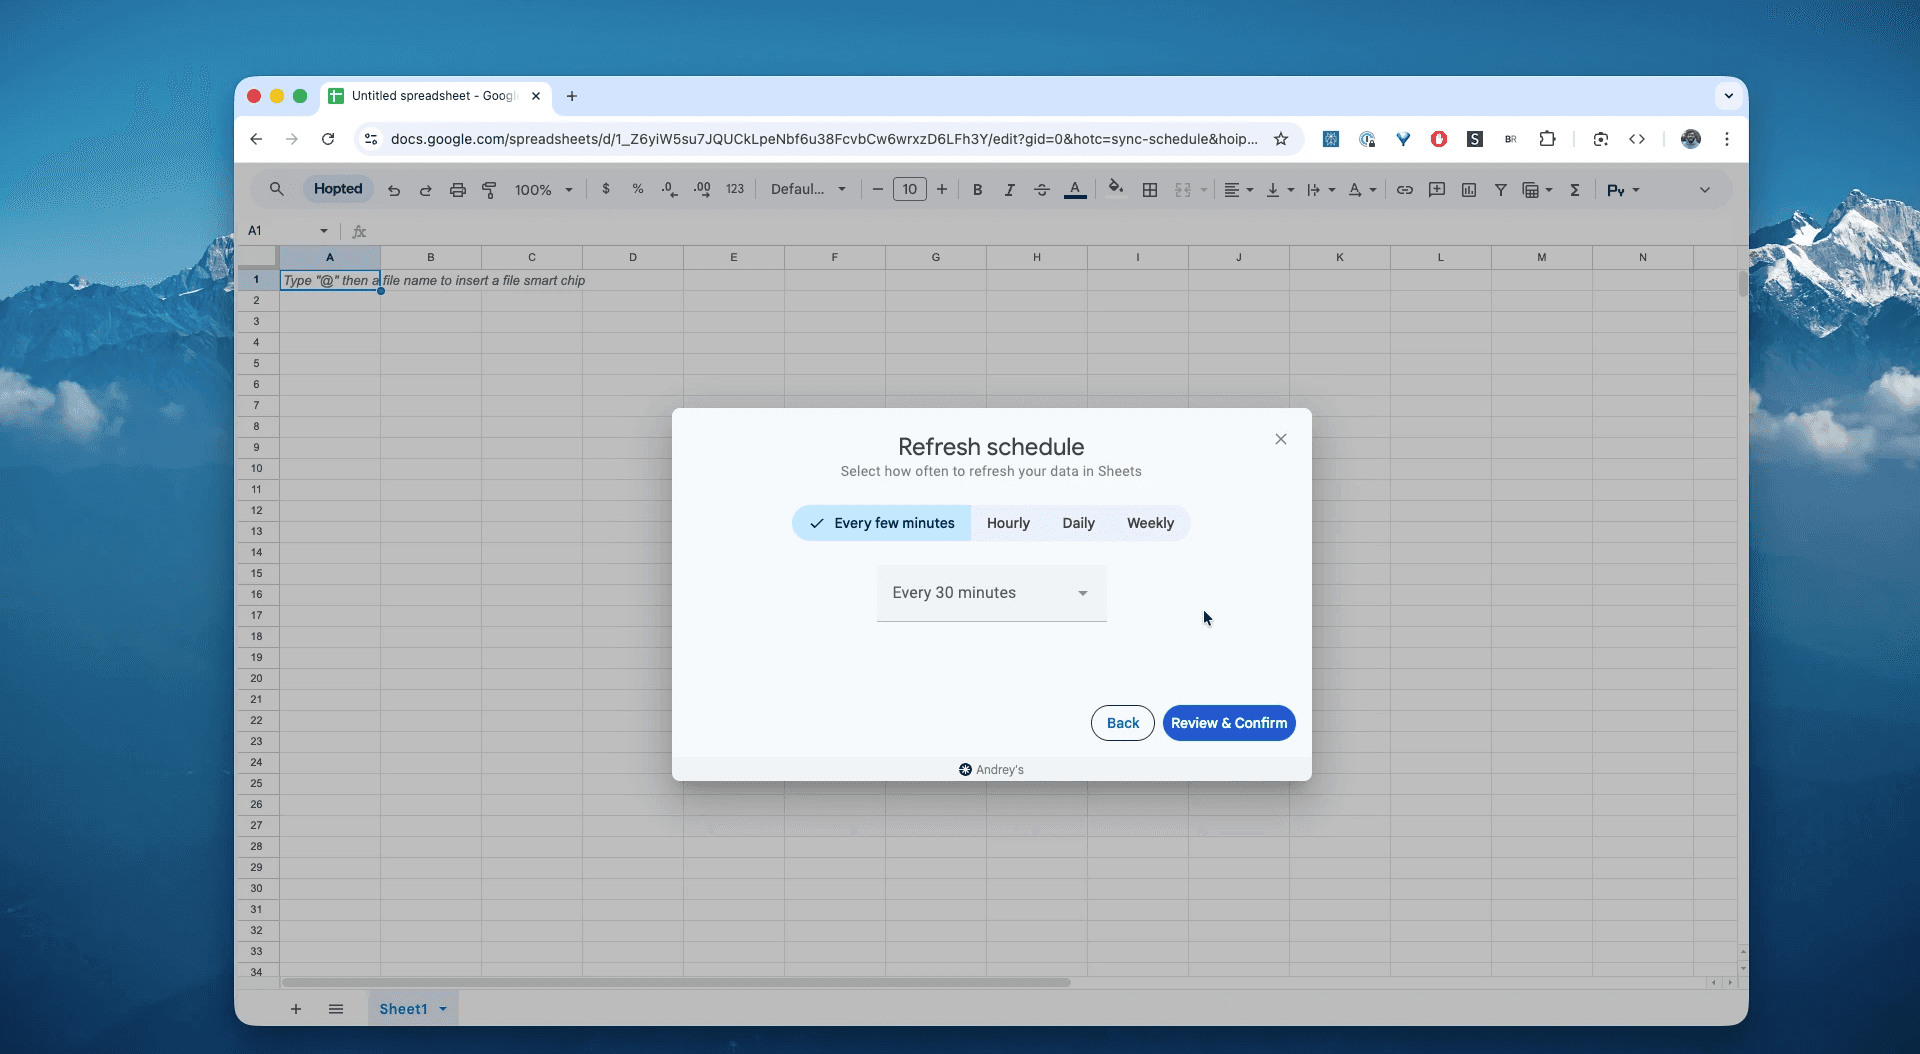
Step 5.
Set your schedule. Choose how often you want to export and refresh your FBA fees—every hour, every day, or less frequent.
Step 6.
Save your data pipeline. This will export your FBA fees from Seller Central into spreadsheets instead of dealing with CSVs. Your fees in your spreadsheets will be up to data forever.
What is the Amazon FBA Fees Preview Report?
This report is your "FBA fee estimate" for all your currently listed FBA products. It shows you what Amazon expects to charge you for fulfillment (Pick & Pack, Weight Handling) and storage based on the dimensions and weight they have on file. This is the most critical report for auditing your costs. This report is the key to answering: "Are Amazon's dimensions for my product correct, and am I being charged the right fee?"
This makes it the single source of truth for answering questions like:
What’s the minimum price that still protects our target margin per SKU?How will upcoming fee changes affect next month’s gross margin?Which SKUs sit on a size-tier edge where minor packaging tweaks could cut fees?Do any SKUs show estimated fees wildly out of line with actuals (settlement)?Which marketplace has the highest estimated fees/unit for this ASIN family?Are the products with incorrect dimensions or weights that results in the wrong fees?
How to Analyze & Track Your Amazon FBA Fees in Spreadsheets
Now that you have a live feed, you can move from data entry to data analysis. This is the real power of analyzing your Amazon Seller Central data in spreadsheets and building your Amazon excel-like template.
Here are 3 Amazon spreadsheet template ideas you can build immediately:
Template 1: The "Live Profitability" Dashboard
This is your master sheet for pricing and profit. By syncing Estimated Fee Total into your master product sheet, you can combine it with your COGS and sale price to see your true, live-synced net profit on every SKU.
How to build it: On your main product list...
Column A:
SKUColumn B:
COGS(Manual Entry)Column C:
Sale Price(Manual or from another report)Column D:
Est. FBA Fee =VLOOKUP(A2, HoptedFeeData!A:G, 7, FALSE)(This formula pulls the liveEstimated Fee Totalfrom your Hopted-synced tab).
Formula: In Column E, your Net Profit formula:
=C2 - B2 - D2What it shows you: A live, auto-updating profit calculation. If Amazon changes your fee, your dashboard will reflect it immediately.
Template 2: The "Dimension Change" Alert
This is your watchdog for "cubiscan" errors, resulting in incorrect product dimensions or incorrect weights listed in Amazon. Amazon can re-measure your product at any time. When you track your Amazon data daily, you can set up a simple alert in Google Sheets to flag any SKU where the Estimated Fee Total or Product Size Tier changes from one day to the next.
How to build it: Hopted syncs the report daily, overwriting the data. You need a simple Google Apps Script that triggers on edit, copies the SKU, Dimensions, and Fee to a "Log" sheet.
Simpler Way (No Script): Use conditional formatting to compare the live data against a "Master Dimension" sheet you created.
What it shows you: You get an instant alert or a highlighted row the moment Amazon's on-file dimensions for your product change, allowing you to open a support case immediately.
Template 3: The "Fee vs. Actuals" Audit Sheet
This is how you find real overcharges. Use Hopted to also pull your Financial Transactions report. In Google Sheets, you can use VLOOKUP to compare the Estimated Fee Total (from this report) against the actual FBA Fee (from your financial report) for the same SKU. This is how you find systemic overcharges.
How to build it: This requires two Hopted-synced tabs: FeePreviewData and FinancialData.
Action: In a new tab, pull all your SKUs.
Column B:
Estimated Fee(VLOOKUP fromFeePreviewData)Column C:
Actual Fee(VLOOKUP fromFinancialData, matching a recentFBA Feetransaction for that SKU).
Formula: In Column D:
=(C2 - B2)What it shows you: This formula flags any difference. If your actual fee is consistently higher than your estimated fee, you have a major problem to investigate.
Common workflows this report unlocks
De-risk launches: confirm unit economics before you go live.
Protect contribution margin: derive minimum viable price per SKU given estimated fees.
Optimize packaging: tweak dimensions/weight to drop a size tier and lower fees.
Profit and loss: for your business accounting it unlocks you margins and profitability
Plan for policy shifts: model upcoming fee changes ahead of effective dates.
FAQ about Amazon FBA Fees
Q: What fees are included in the Fee Preview report?
Estimated Selling on Amazon (referral) and FBA fulfillment fees for your current FBA offers. Use for planning; actuals may differ.
Q: Does the FBA Fee Preview show size tier, dimensions, and weight?
Yes—size-tier and measurement data are commonly referenced to understand fee drivers (weight/dims). Use them for packaging optimization.
Q: Can I see future fee changes in the report?
Amazon provides fee previews ahead of changes so you can estimate impacts (e.g., 2024+ updates); watch the future fee indicators and model deltas.
Q: How should I use Fee Preview with my repricer?
Convert Fee Preview into price floors and margin guardrails; update when fee previews change to avoid accidental underpricing.
Q: How do I find my Amazon FBA fees for all my products?
The "FBA Fee Preview Report" in Seller Central is the best place. It lists all your products and their estimated FBA fees. To analyze this data, the best method is to pull the report into Google Sheets with an automation tool, which lets you sort, filter, and track fees easily.
Q: Why is my Amazon FBA fee so high?
This is often due to incorrect product dimensions or weight. Amazon's "cubiscan" machine may have measured your product incorrectly, placing it in a larger, more expensive Product Size Tier. You must pull your FBA Fee Preview report to check the dimensions Amazon has on file and open a case if they are wrong.
Q: How do I create an Amazon FBA fee calculator in a spreadsheet?
The best way is to build a live calculator. Use an Amazon to Google Sheets integration like Hopted to sync your FBA Fee Preview report to one tab. In another tab, list your SKUs and use a VLOOKUP formula to pull the Estimated Fee Total for each product. You can then add your COGS and sale price to calculate your net profit.
Q: What's the difference between the FBA Fee Preview report and my actual FBA fees?
The Fee Preview is an estimate based on the dimensions and weight Amazon has on file right now. The Actual Fee is the final amount charged to you when an item ships, which you can see in the Financial Transactions Report. You should connect both reports to Google Sheets to compare them. If the actual fee is consistently higher, it's a major red flag.
Q: How do I get an FBA fee reimbursement for overcharges?
First, you need proof. Automate your FBA Fee Preview report to track your product's dimensions. If you see they are wrong (e.g., Amazon has 10kg but your product is 5kg), open a support case with Amazon. Provide your proof (e.g., from your supplier or a photo with a tape measure) to request a re-measurement and a reimbursement for past overcharges.
Q: How is Hopted different from other Amazon seller software?
Most Amazon tools force you into their rigid dashboards and pre-built reports. You have to change your workflow to fit their software. With Hopted is the opposite. It’s a flexible data automation layer that works directly inside your existing spreadsheets (like Google Sheets). Instead of forcing you to learn a new system, Hopted brings all your scattered Amazon data (sales, inventory, orders, etc.) right to you. You can build the fully custom reports and automations you need, not the ones a rigid tool dictates.


Hopted,
explained.
Watch the film