The FBA Inventory Ledger (Summary) Report is built to answer these "big picture" questions. Are your damaged units increasing? Are your customer returns stable? Are your warehouse receipts keeping pace with your shipments? This guide shows you how to stop managing static reports and start building a live dashboard. We'll cover how to automatically pull your Inventory Ledger (Summary) report directly into Google Sheets so you can track inventory trends and monitor your business's health at a glance.

How to Automatically Sync & Import the FBA Inventory Ledger Summary Report to Google Sheets (The Hopted Way)
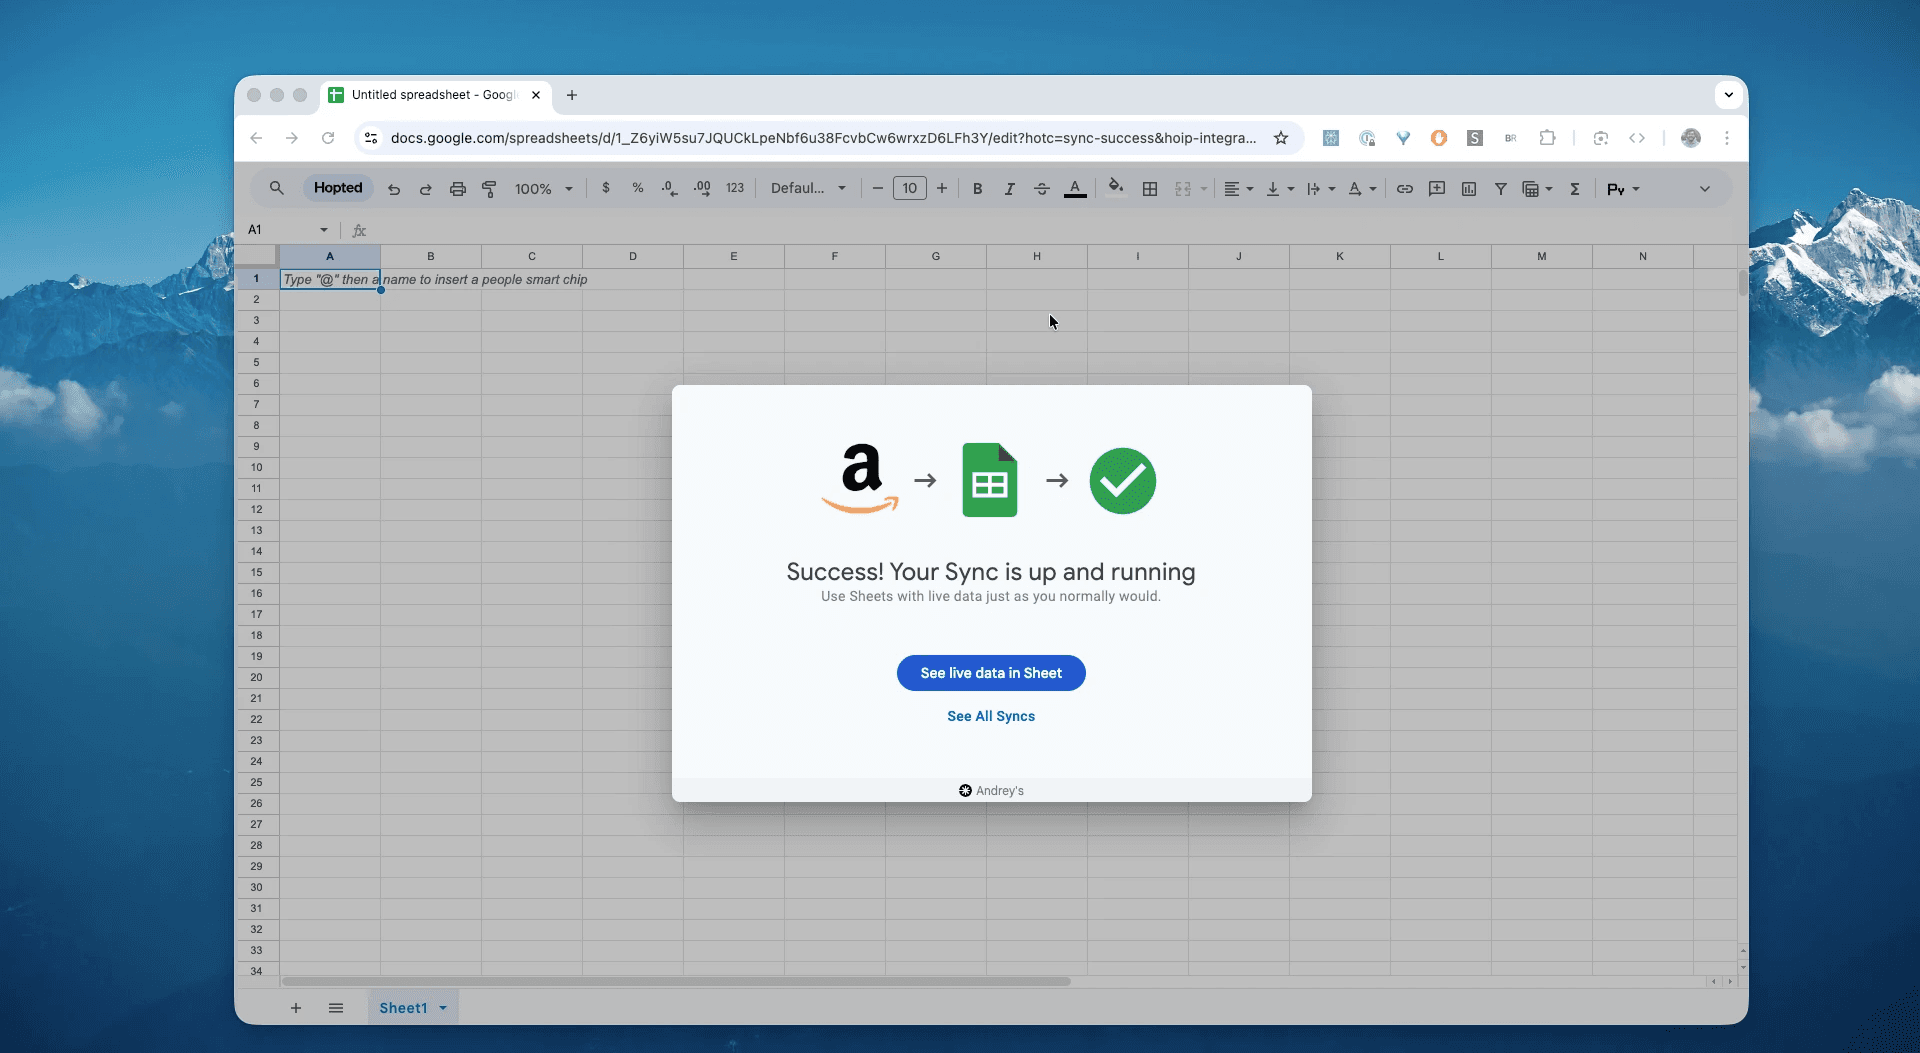
Using an Amazon to Google Sheets integration like Hopted, you set up the connection once, and your data flows automatically.
Step 1.
Install the Hopted browser extension and sign in using your Google Account.
Step 2.
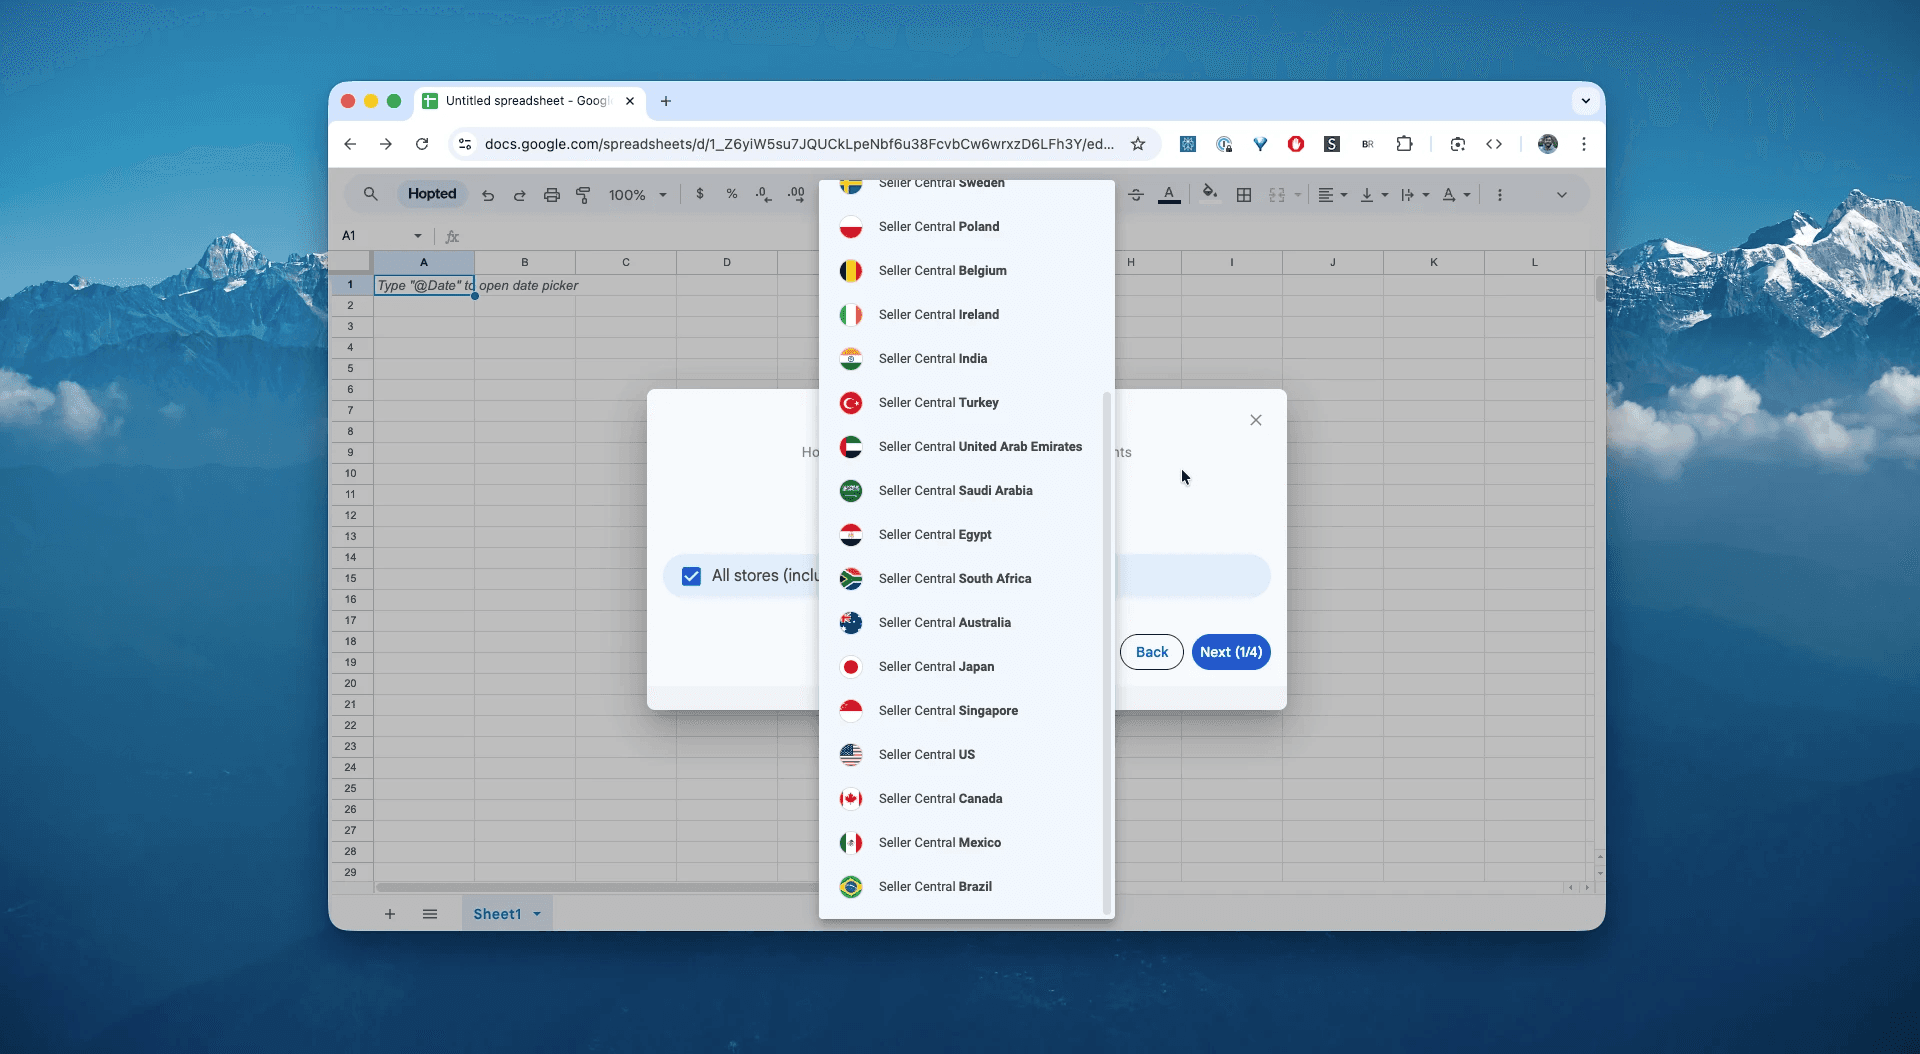
Securely connect your Amazon Seller Central to Google Sheets using Hopted's integration wizard.
Step 3.
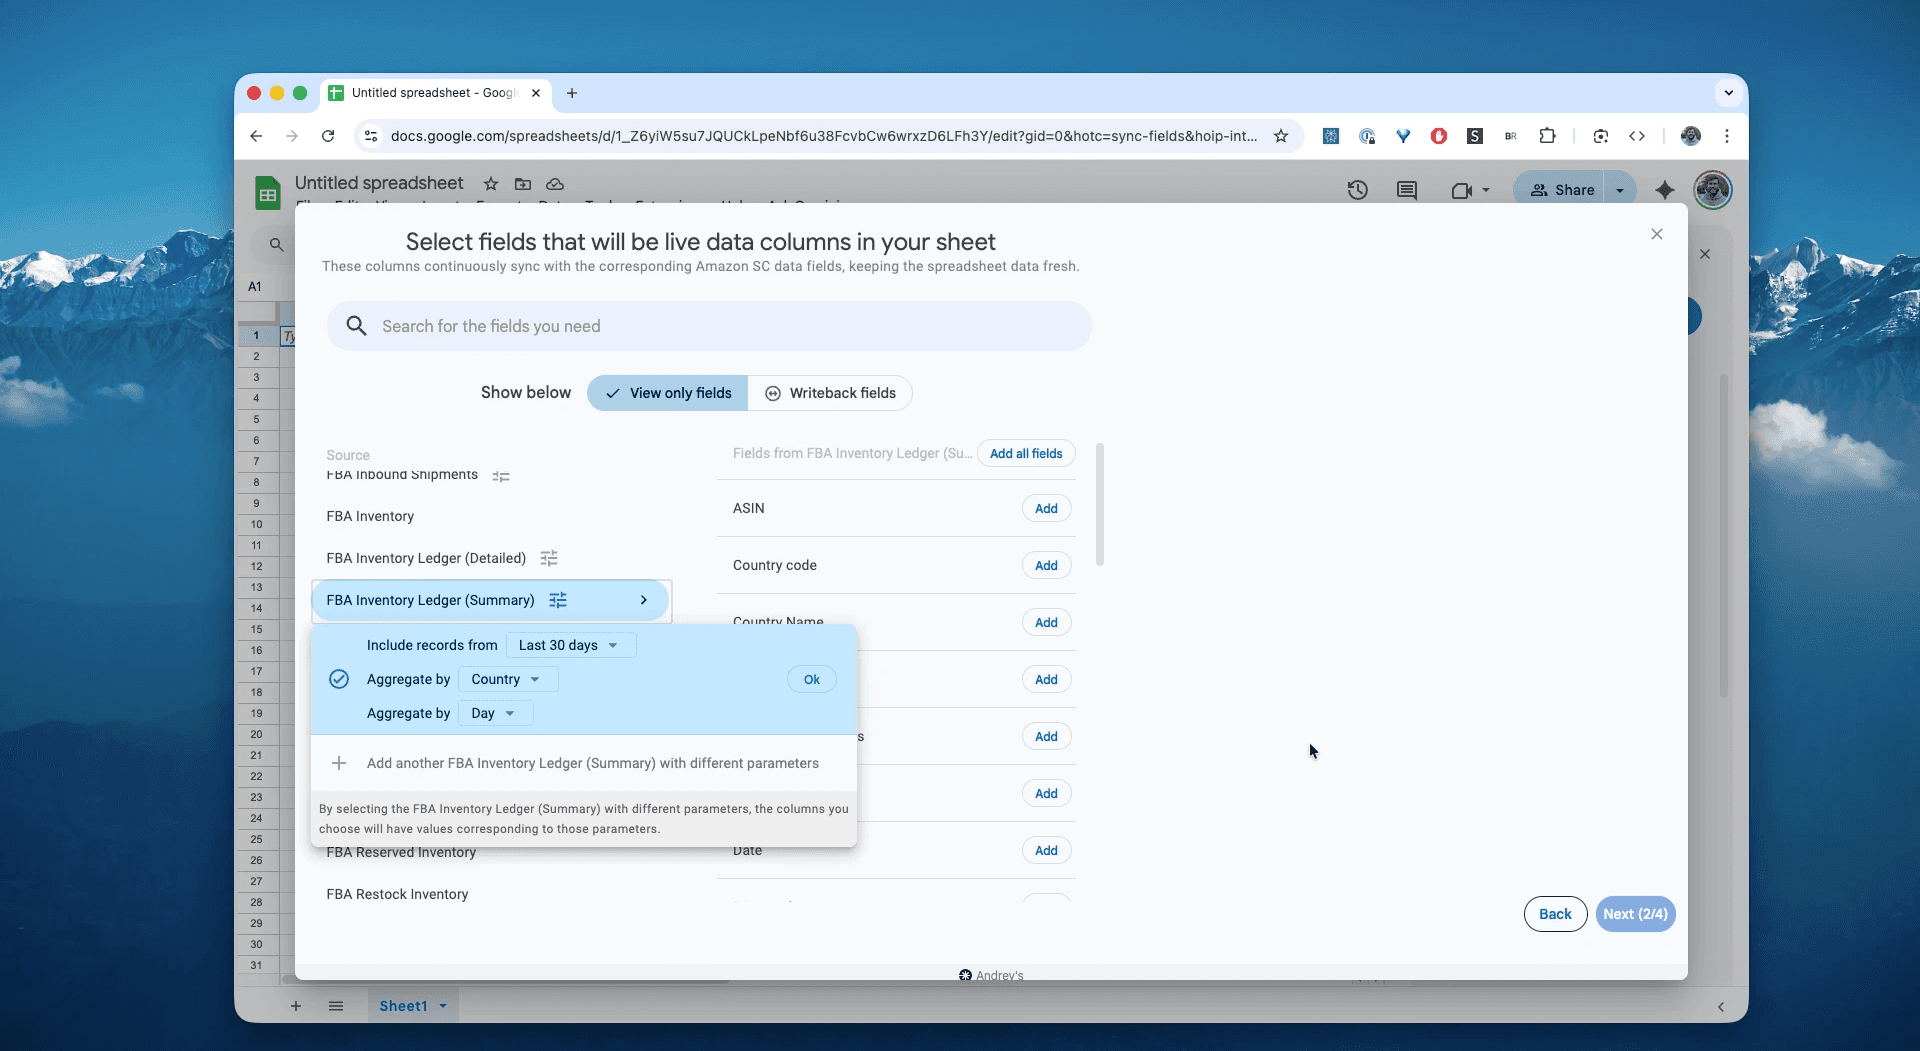
In Google Sheets, from the list of available Amazon Seller Central reports, select "FBA Inventory Ledger (Summary)" for a specific date range and aggregation. This can be as recent as the "Last 7 days" or a custom range going as far back as 35 months. Select Country to display inventory location by country or Fulfillment center to display inventory location by fulfillment center. Select the desired time period for the report, such as monthly, weekly, or daily. For this example, we'll select "Include records for the last 30 days, aggregated by country, daily".
Step 4.
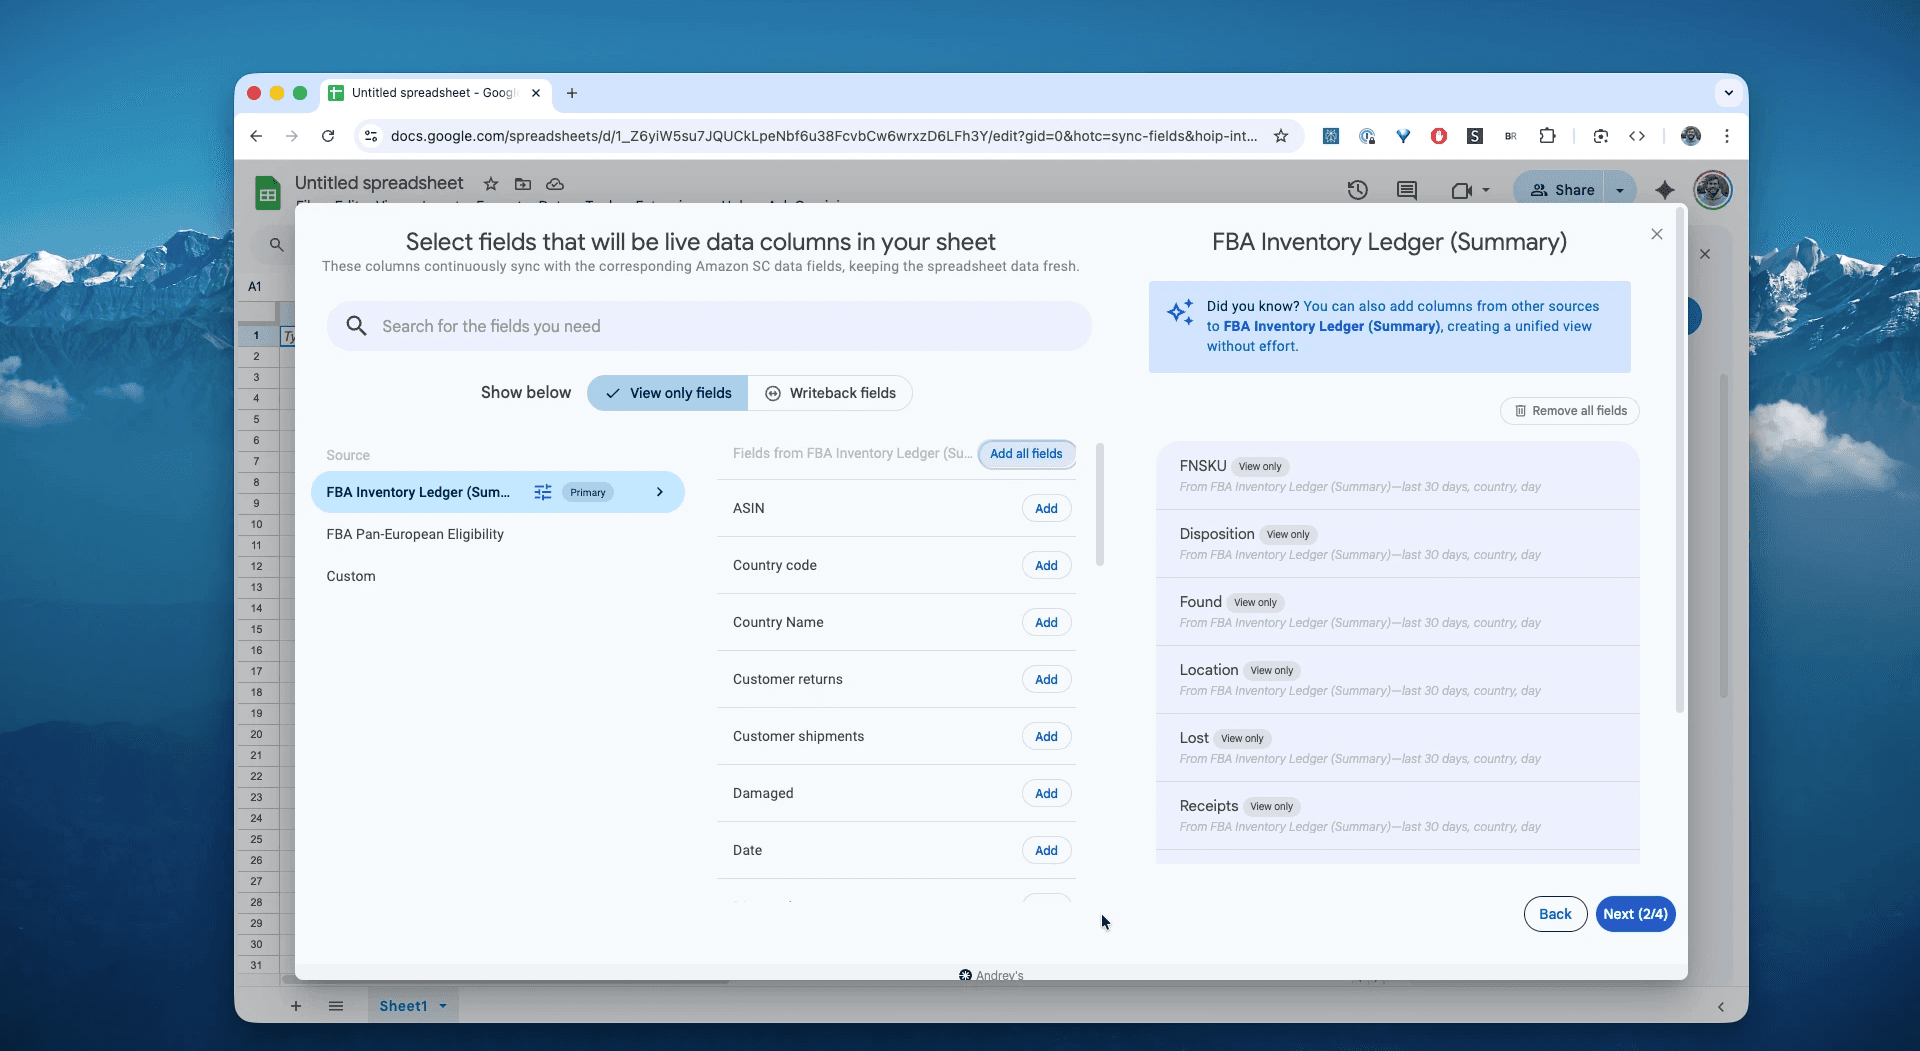
Select columns that you need: FNSKU, Disposition, Damaged, Found, Lost, Location, Starting and Ending Warehouse balance, and other fields.
Step 5.
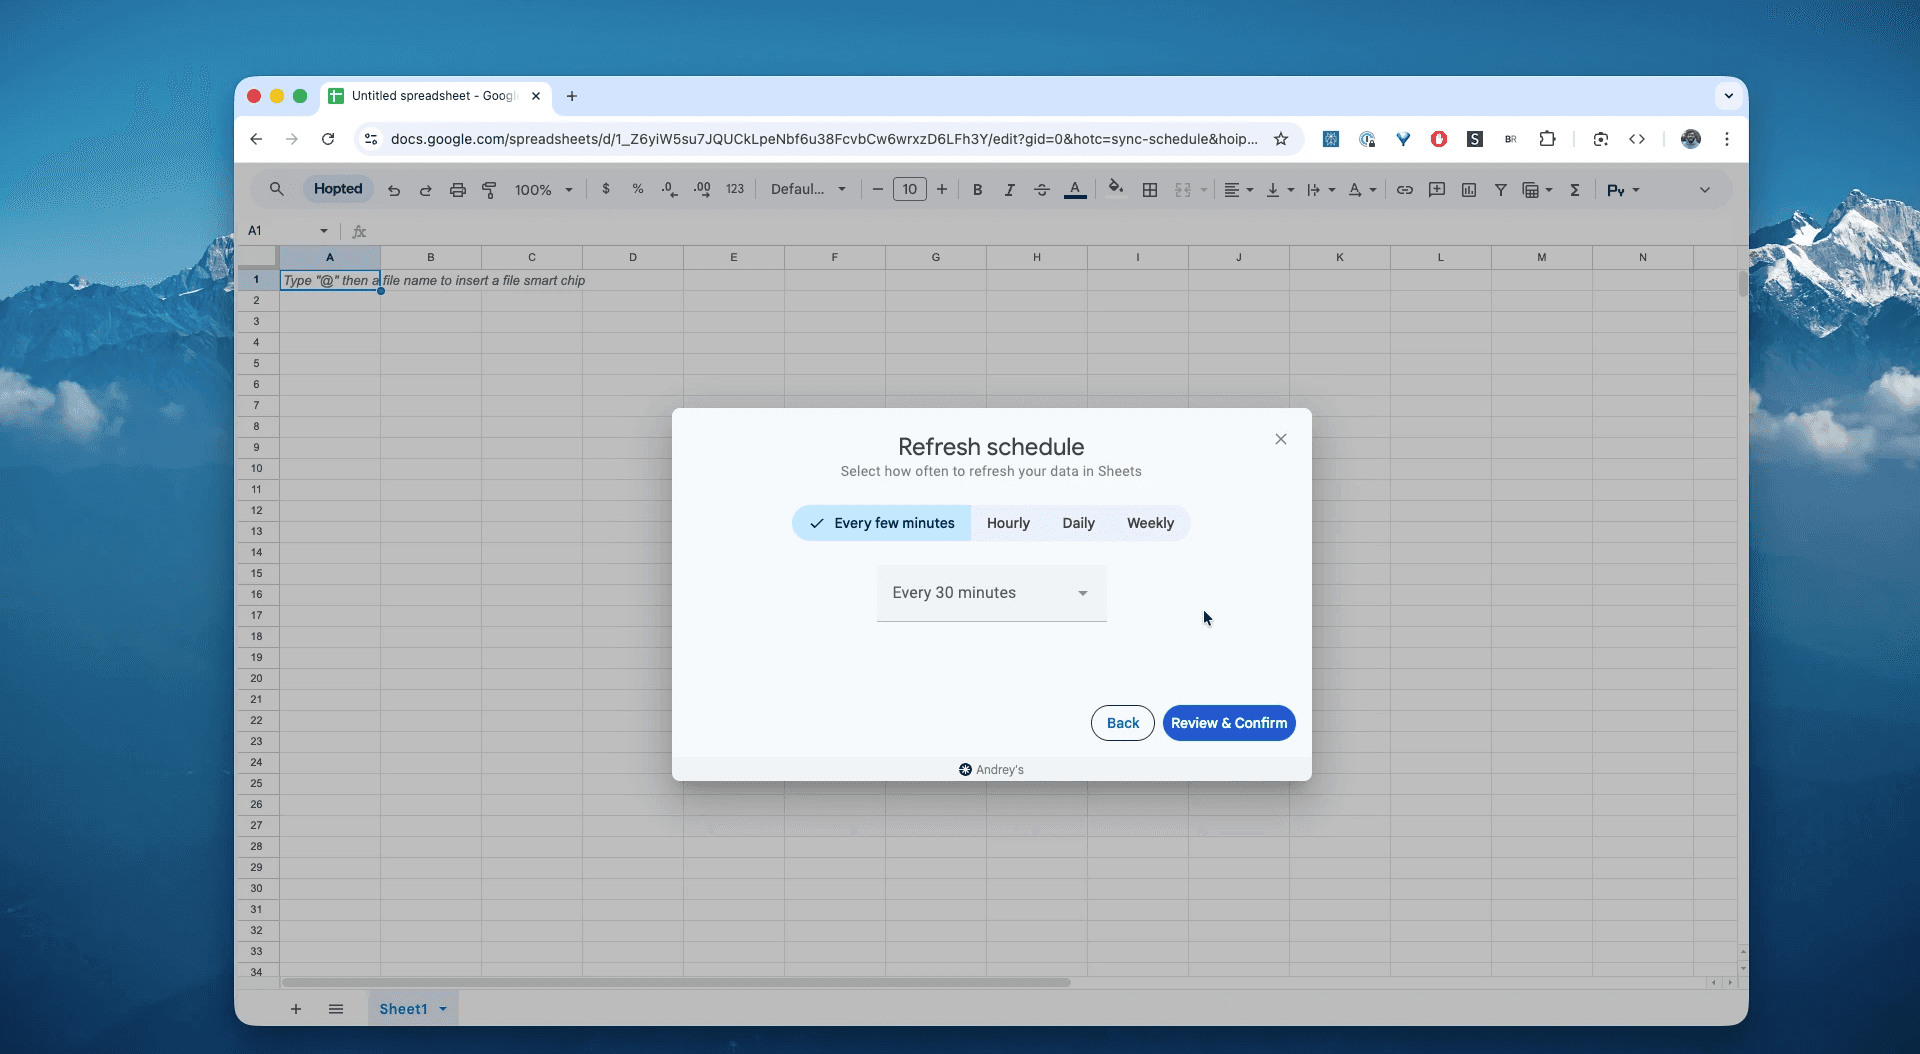
Set your schedule. Choose how often you want to export and refresh your history of FBA inventory events—every hour, every day, or less frequent.
Step 6.
Save your data pipeline. This will export your history of inventory events from Seller Central into spreadsheets instead of dealing with CSVs. The inventory ledger summary in your spreadsheets will be up to data forever.
What is the Amazon FBA Inventory Ledger (Summary) Report?
This report is your "30,000-foot view" of inventory flow. It provides aggregated totals of all inventory movements (like receipts, shipments, damages, and returns) grouped by ASIN, fulfillment center, and date. Instead of seeing 1,000 individual sales, you'll see one line item: "Shipments: -1,000 units." You must use the Summary view for effective, high-level KPI tracking.
Shrink Radar (lost/damaged/found by FC).
Transfer Exposure View (In-transit and net transfers).
Returns Monitor (customer vs. vendor returns trend).
Month-Close Reconciliation Workbook (ready formulas + checks).
This makes it the single source of truth for answering questions like:
What was my total number of units lost or damaged in Q3?Did my customer returns increase or decrease last month?How many units did I receive into FBA versus how many I sold?What is our month-end ending balance by SKU and by Country/FC?How much shrink (lost/damaged) did we incur this week/month, and where?How many units are in transit between warehouses, and is that number rising?What are the net transfers and returns (customer/vendor) by location?Where do unknown events spike, and does widening the period reduce them?
How to Analyze & Track Your Inventory Ledger Summary in Spreadsheets
Now that you have a live feed, you can move from data entry to data analysis. This is the real power of analyzing your Amazon Seller Central data in spreadsheets and building your Amazon excel-like template.
Here are 3 Amazon spreadsheet template ideas you can build immediately:
Template 1: Build a Live Inventory Dashboard
This is the #1 use case. By automatically appending data (e.g., every week or month) to one Google Sheet, you can build charts that show your inventory flow over time.
How to build it: Create a Pivot Table.
Rows:
End Date(right-click and "Group" by Year-Month).Columns:
Transaction Type(e.g., Receipts, Shipments, CustomerReturns, WH_Damaged, Inv_Lost).Values:
SUM of Quantity.What it shows you: A clean, month-over-month view of your entire inventory flow. You can instantly see if "Receipts" (inbound) are keeping up with "Shipments" (sales) or if "Damaged" units spiked in March.
Template 2: The "ASIN Health" Tracker
Quickly identify your most problematic products.
How to build it: Another Pivot Table.
Rows:
ASIN.Values:
SUM of Quantity.Filter:
Transaction Type(select only negative events likeCustomerReturns,WH_Damaged,Inv_Lost,Disposed).What it shows you: This instantly reveals which ASINs are costing you the most money in "negative" inventory events. It's not for finding one lost unit, but for seeing that "SKU-ABC" had 10x more damages than any other product last quarter.
Template 3: The "Inbound vs. Outbound" Ratio
A simple, powerful KPI for tracking your Amazon data.
How: Create a Pivot Table.
Rows:
Ship stateorShip countryValues:
SUMofQuantity purchasedandSUMofItem priceResult: A simple report showing your top-performing regions, helping you make decisions about inventory and ad spend.
Common workflows this report unlocks
Month-end roll-forward: Prove beginning → ending by SKU/FC/country for accounting and audits.
Shrink visibility: Track lost/damaged/found and unknown events at an aggregated cadence for CFO-grade dashboards.
Network logistics: Monitor transfers and in-transit exposure by FC/country to plan replenishment.
FAQ about FBA Inventory Ledger (Summary)
Q: What’s the difference between Inventory Ledger Summary vs Detailed?
Summary aggregates by time/location for roll-forward balances; Detailed lists per-event movements for forensics. Use both together.
Q: How do I download the Amazon FBA Inventory Ledger (Summary) report?
If you want to extract it manually in Seller Central: Reports → Fulfillment → Inventory Ledger → Summary view; pick Daily/Weekly/Monthly and Country/FC; export TSV. Our recommended way is pulling this report automatically based on the schedule. See the guide above.
Q: What does “In transit between warehouses” mean in the Summary view?
Units moving between Amazon FCs; shown in a separate column, not included in beginning/ending by default.
Q: How do I reduce “Unknown events” in the Inventory Ledger Summary report?
Broaden your date range; unknowns occur when parts of an event fall in different reporting windows.
Q: Can I aggregate by Fulfillment Center instead of Country?
Yes—set aggregateByLocation to FC (default is COUNTRY) when configuring Sync for the Summary view.
Q: How do I track my FBA inventory levels over time?
The most effective method is to sync your Amazon seller metrics from the Inventory Ledger (Summary) report into a single spreadsheet template. This creates a historical database, allowing you to easily build charts to track your Amazon data (like total units damaged, received, or returned) month-over-month.
Q: How is Hopted different from other Amazon seller software?
Most Amazon tools force you into their rigid dashboards and pre-built reports. You have to change your workflow to fit their software. With Hopted is the opposite. It’s a flexible data automation layer that works directly inside your existing spreadsheets (like Google Sheets). Instead of forcing you to learn a new system, Hopted brings all your scattered Amazon data (sales, inventory, orders, etc.) right to you. You can build the fully custom reports and automations you need, not the ones a rigid tool dictates.


Hopted,
explained.
Watch the film