The FBA Inbound Shipments Report is your command center for supply chain visibility. Are your shipments stuck in transit? Did Amazon receive all the units you sent? Which fulfillment centers are receiving your stock? This guide shows you how to stop managing static shipping plans and start building a live supply chain dashboard. We'll cover how to automatically pull your Inbound Shipments report directly into Google Sheets so you can track status updates and catch discrepancies the moment they happen.

How to Automatically Sync & Import the FBA Inbound Shipments Report to Google Sheets (The Hopted Way)
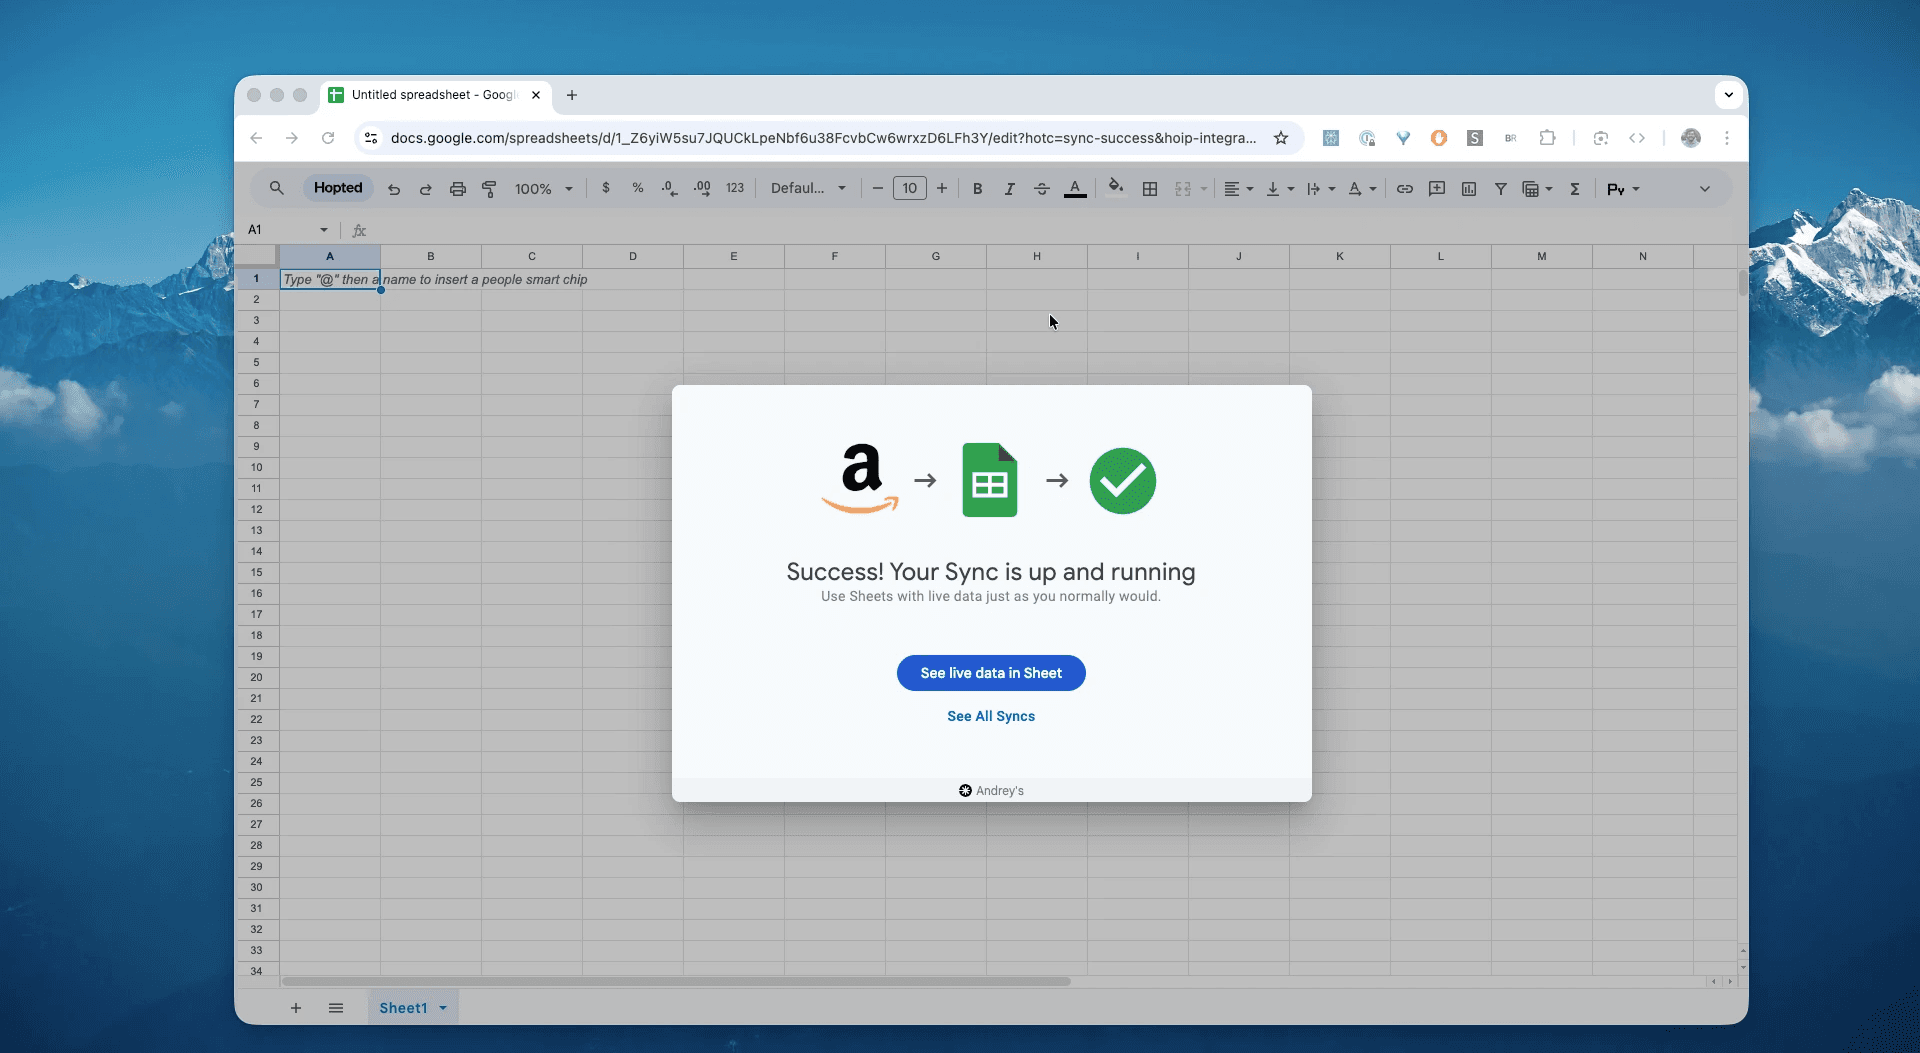
Using an Amazon to Google Sheets integration like Hopted, you set up the connection once, and your data flows automatically.
Step 1.
Install the Hopted browser extension and sign in using your Google Account.
Step 2.
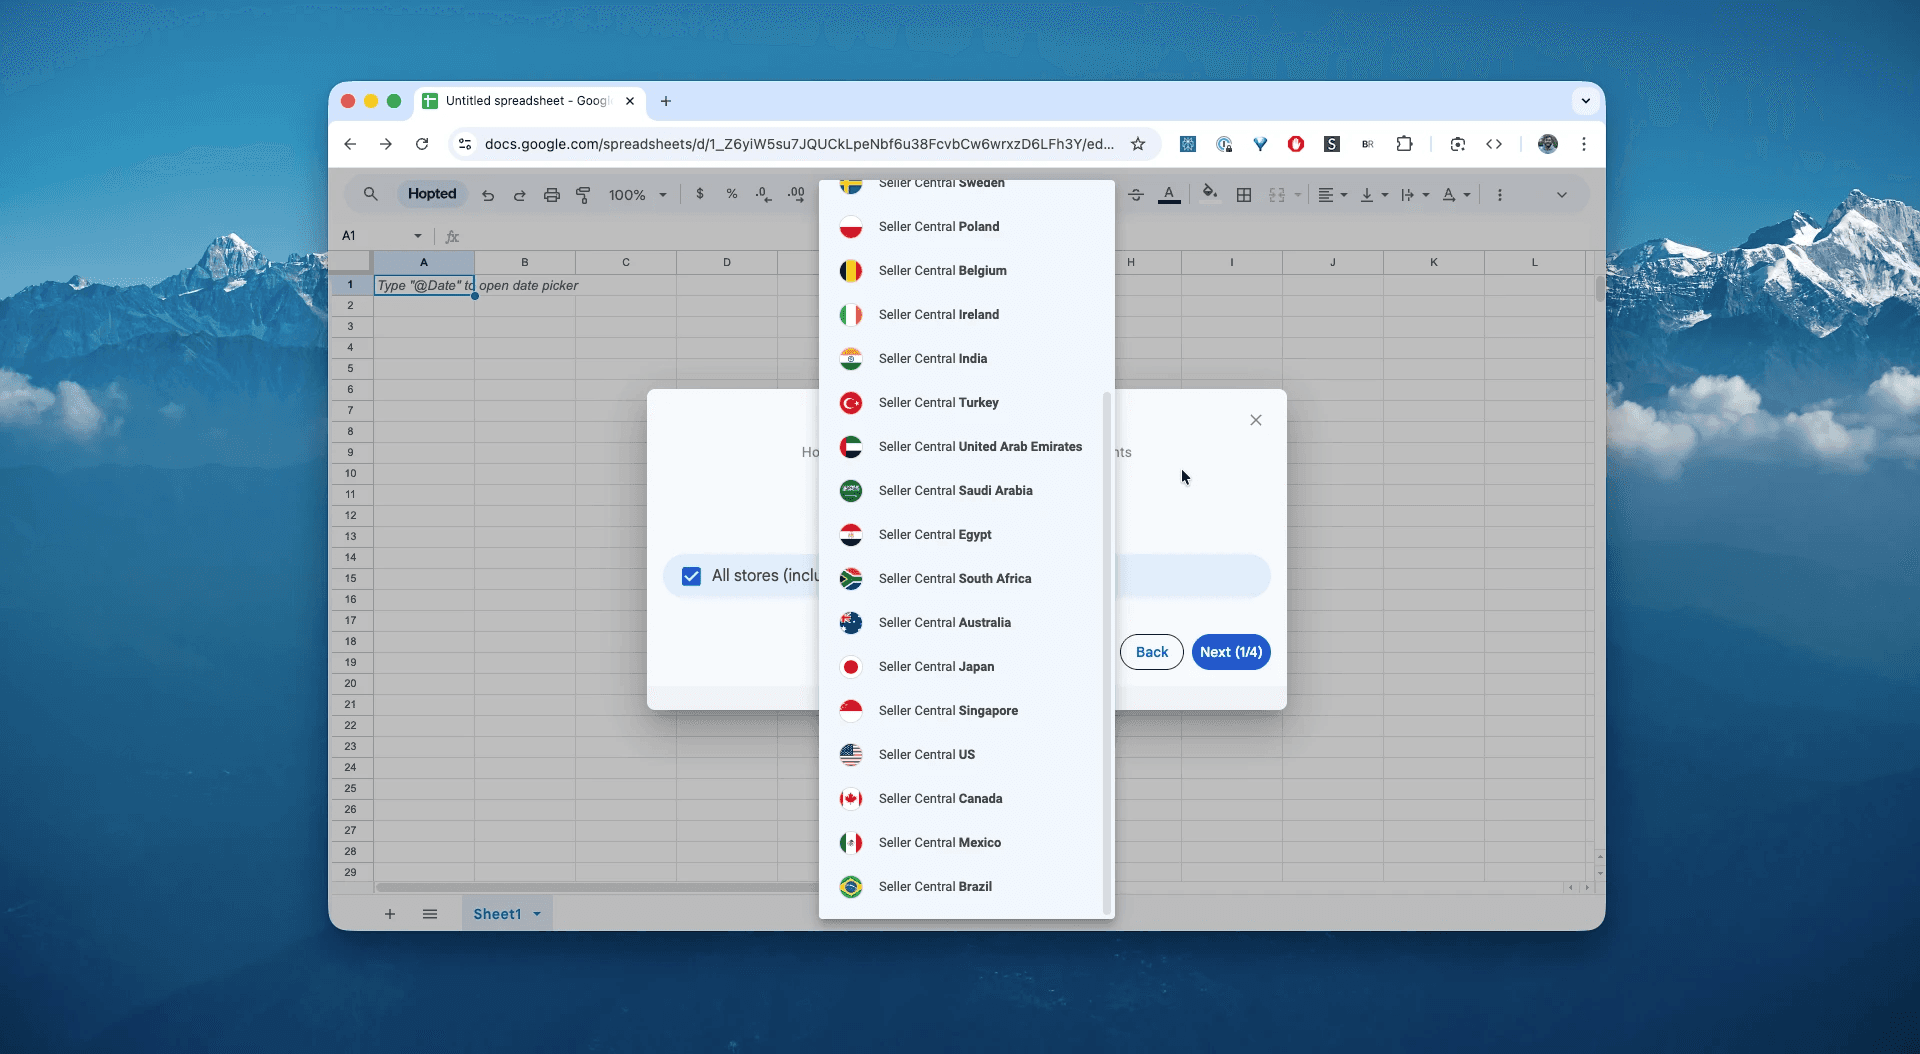
Securely connect your Amazon Seller Central to Google Sheets using Hopted's integration wizard.
Step 3.
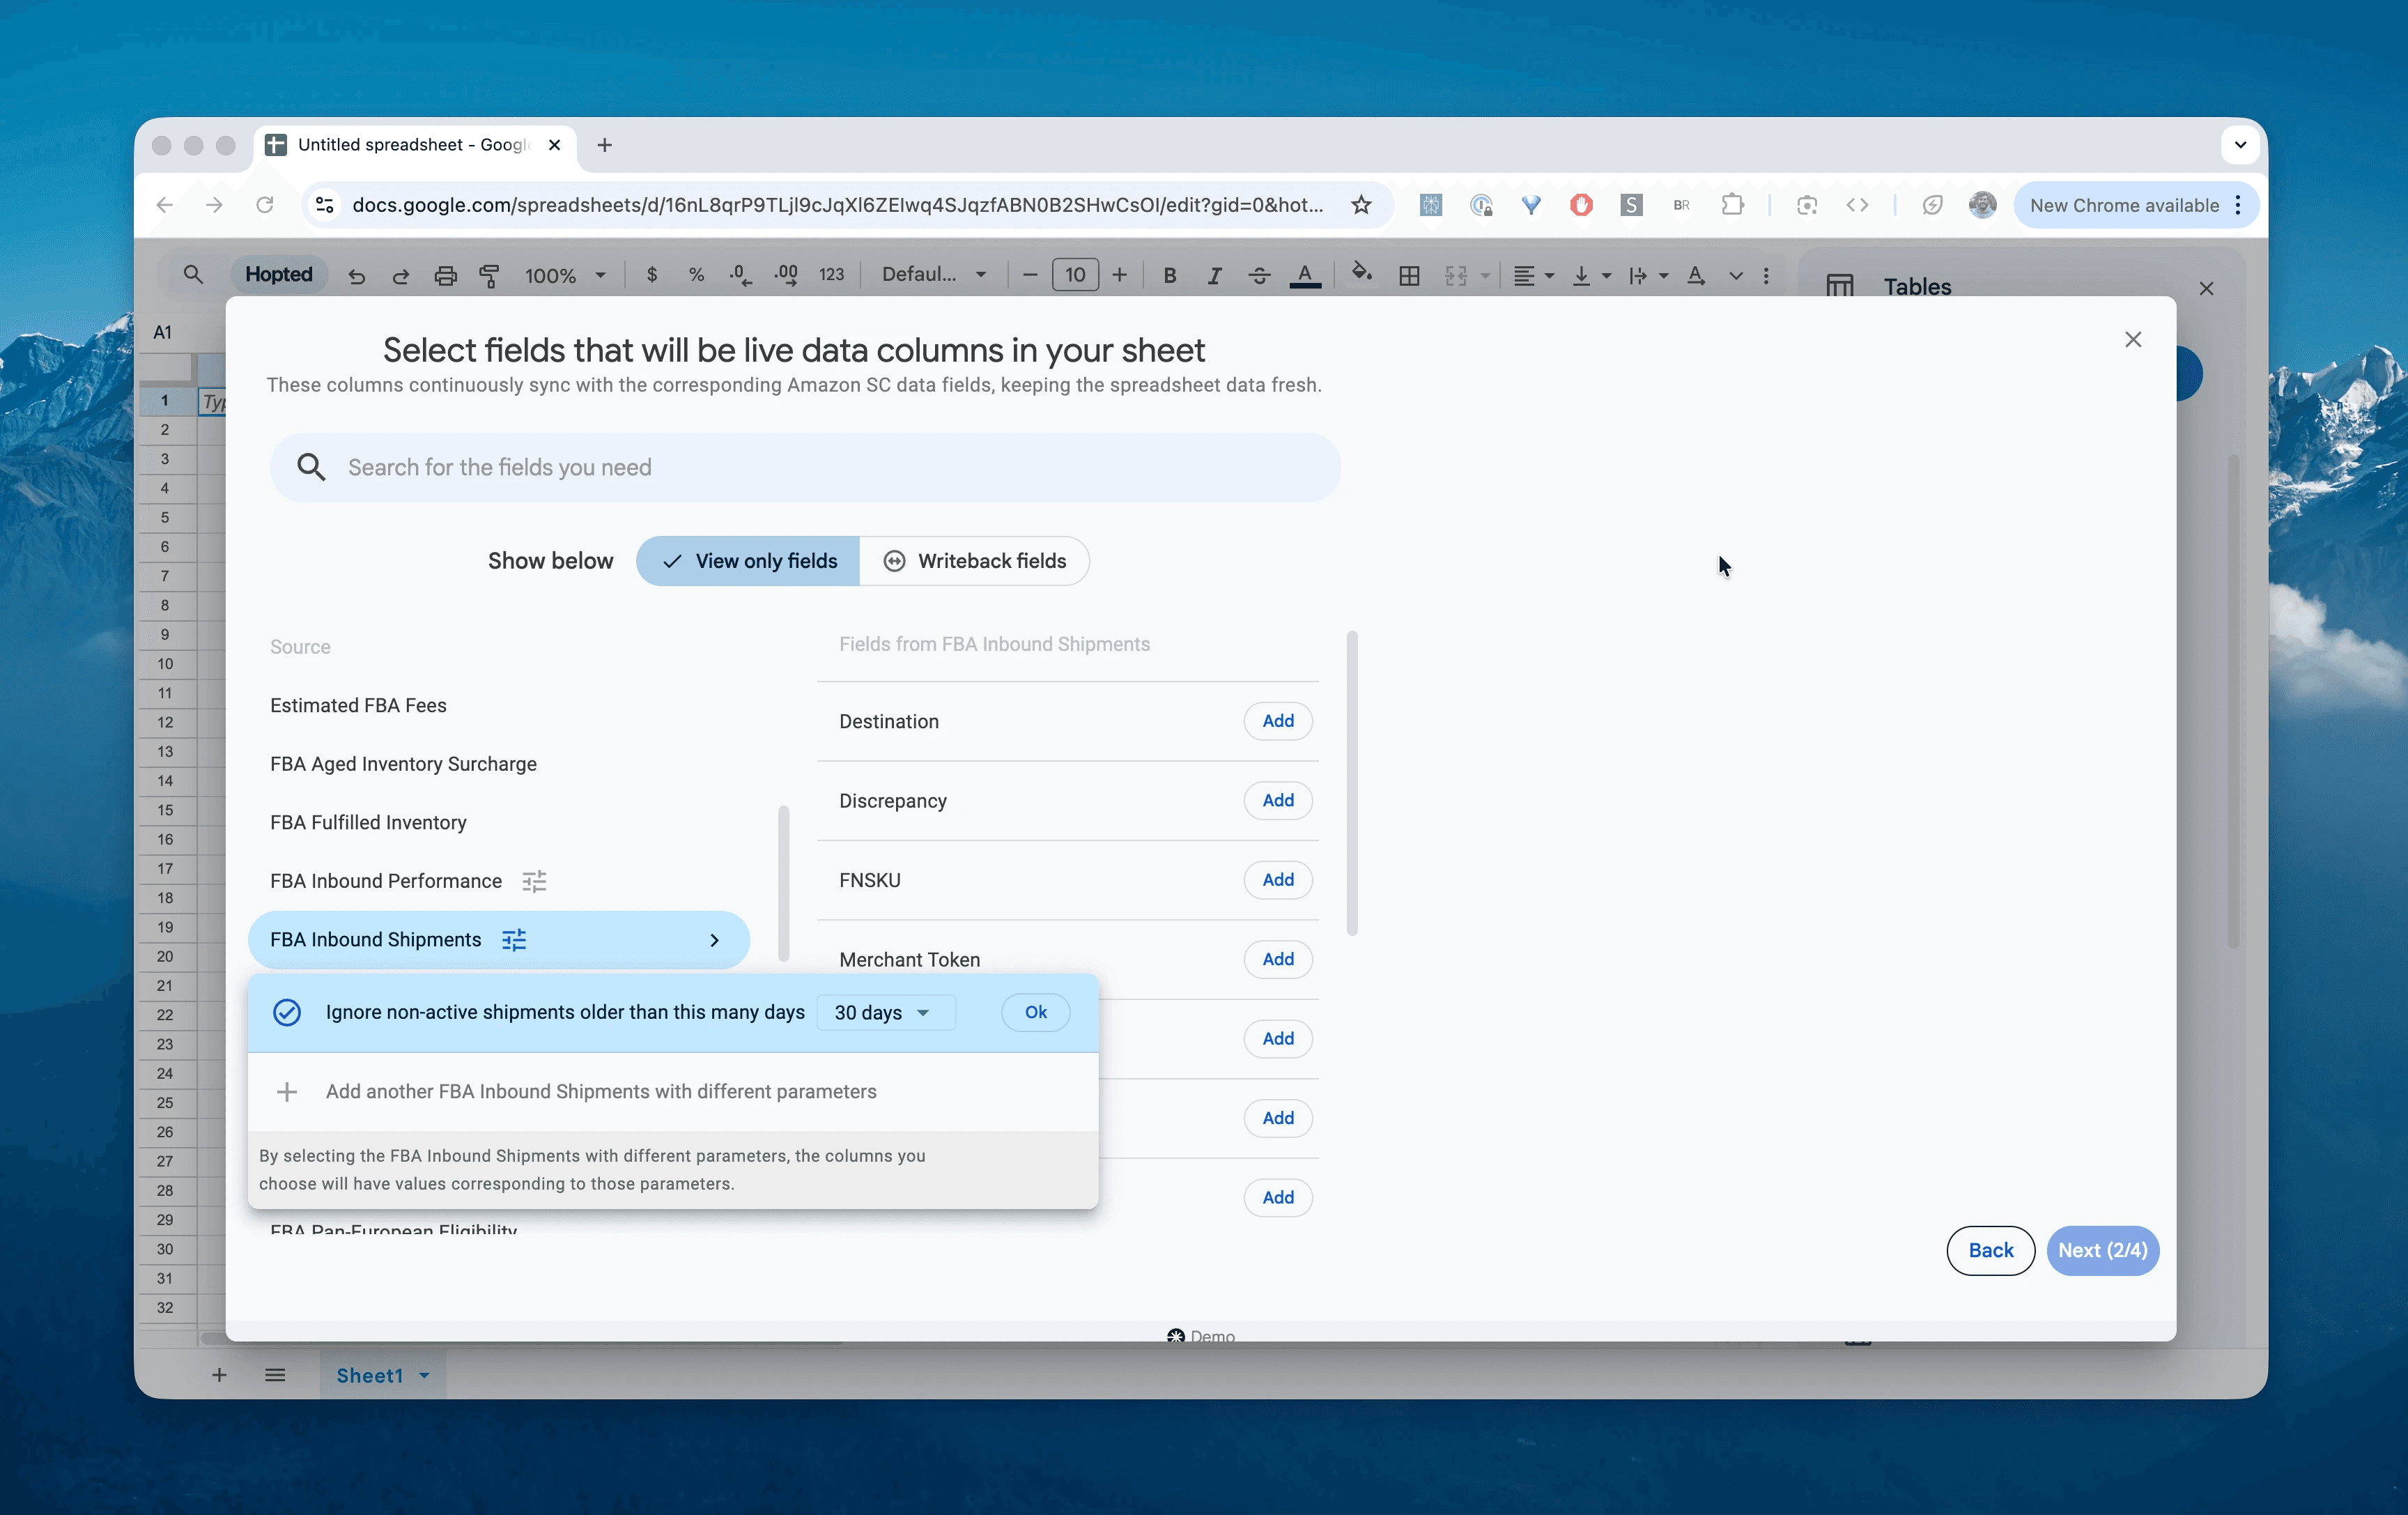
In Google Sheets, from the list of available Amazon Seller Central reports, select "FBA Inbound Shipments" for a specific date range. This can be as recent as the "Last 7 days" or a custom range going as far back as 365 days. For this example, we'll select "Include records for the last 30 days".
Step 4.
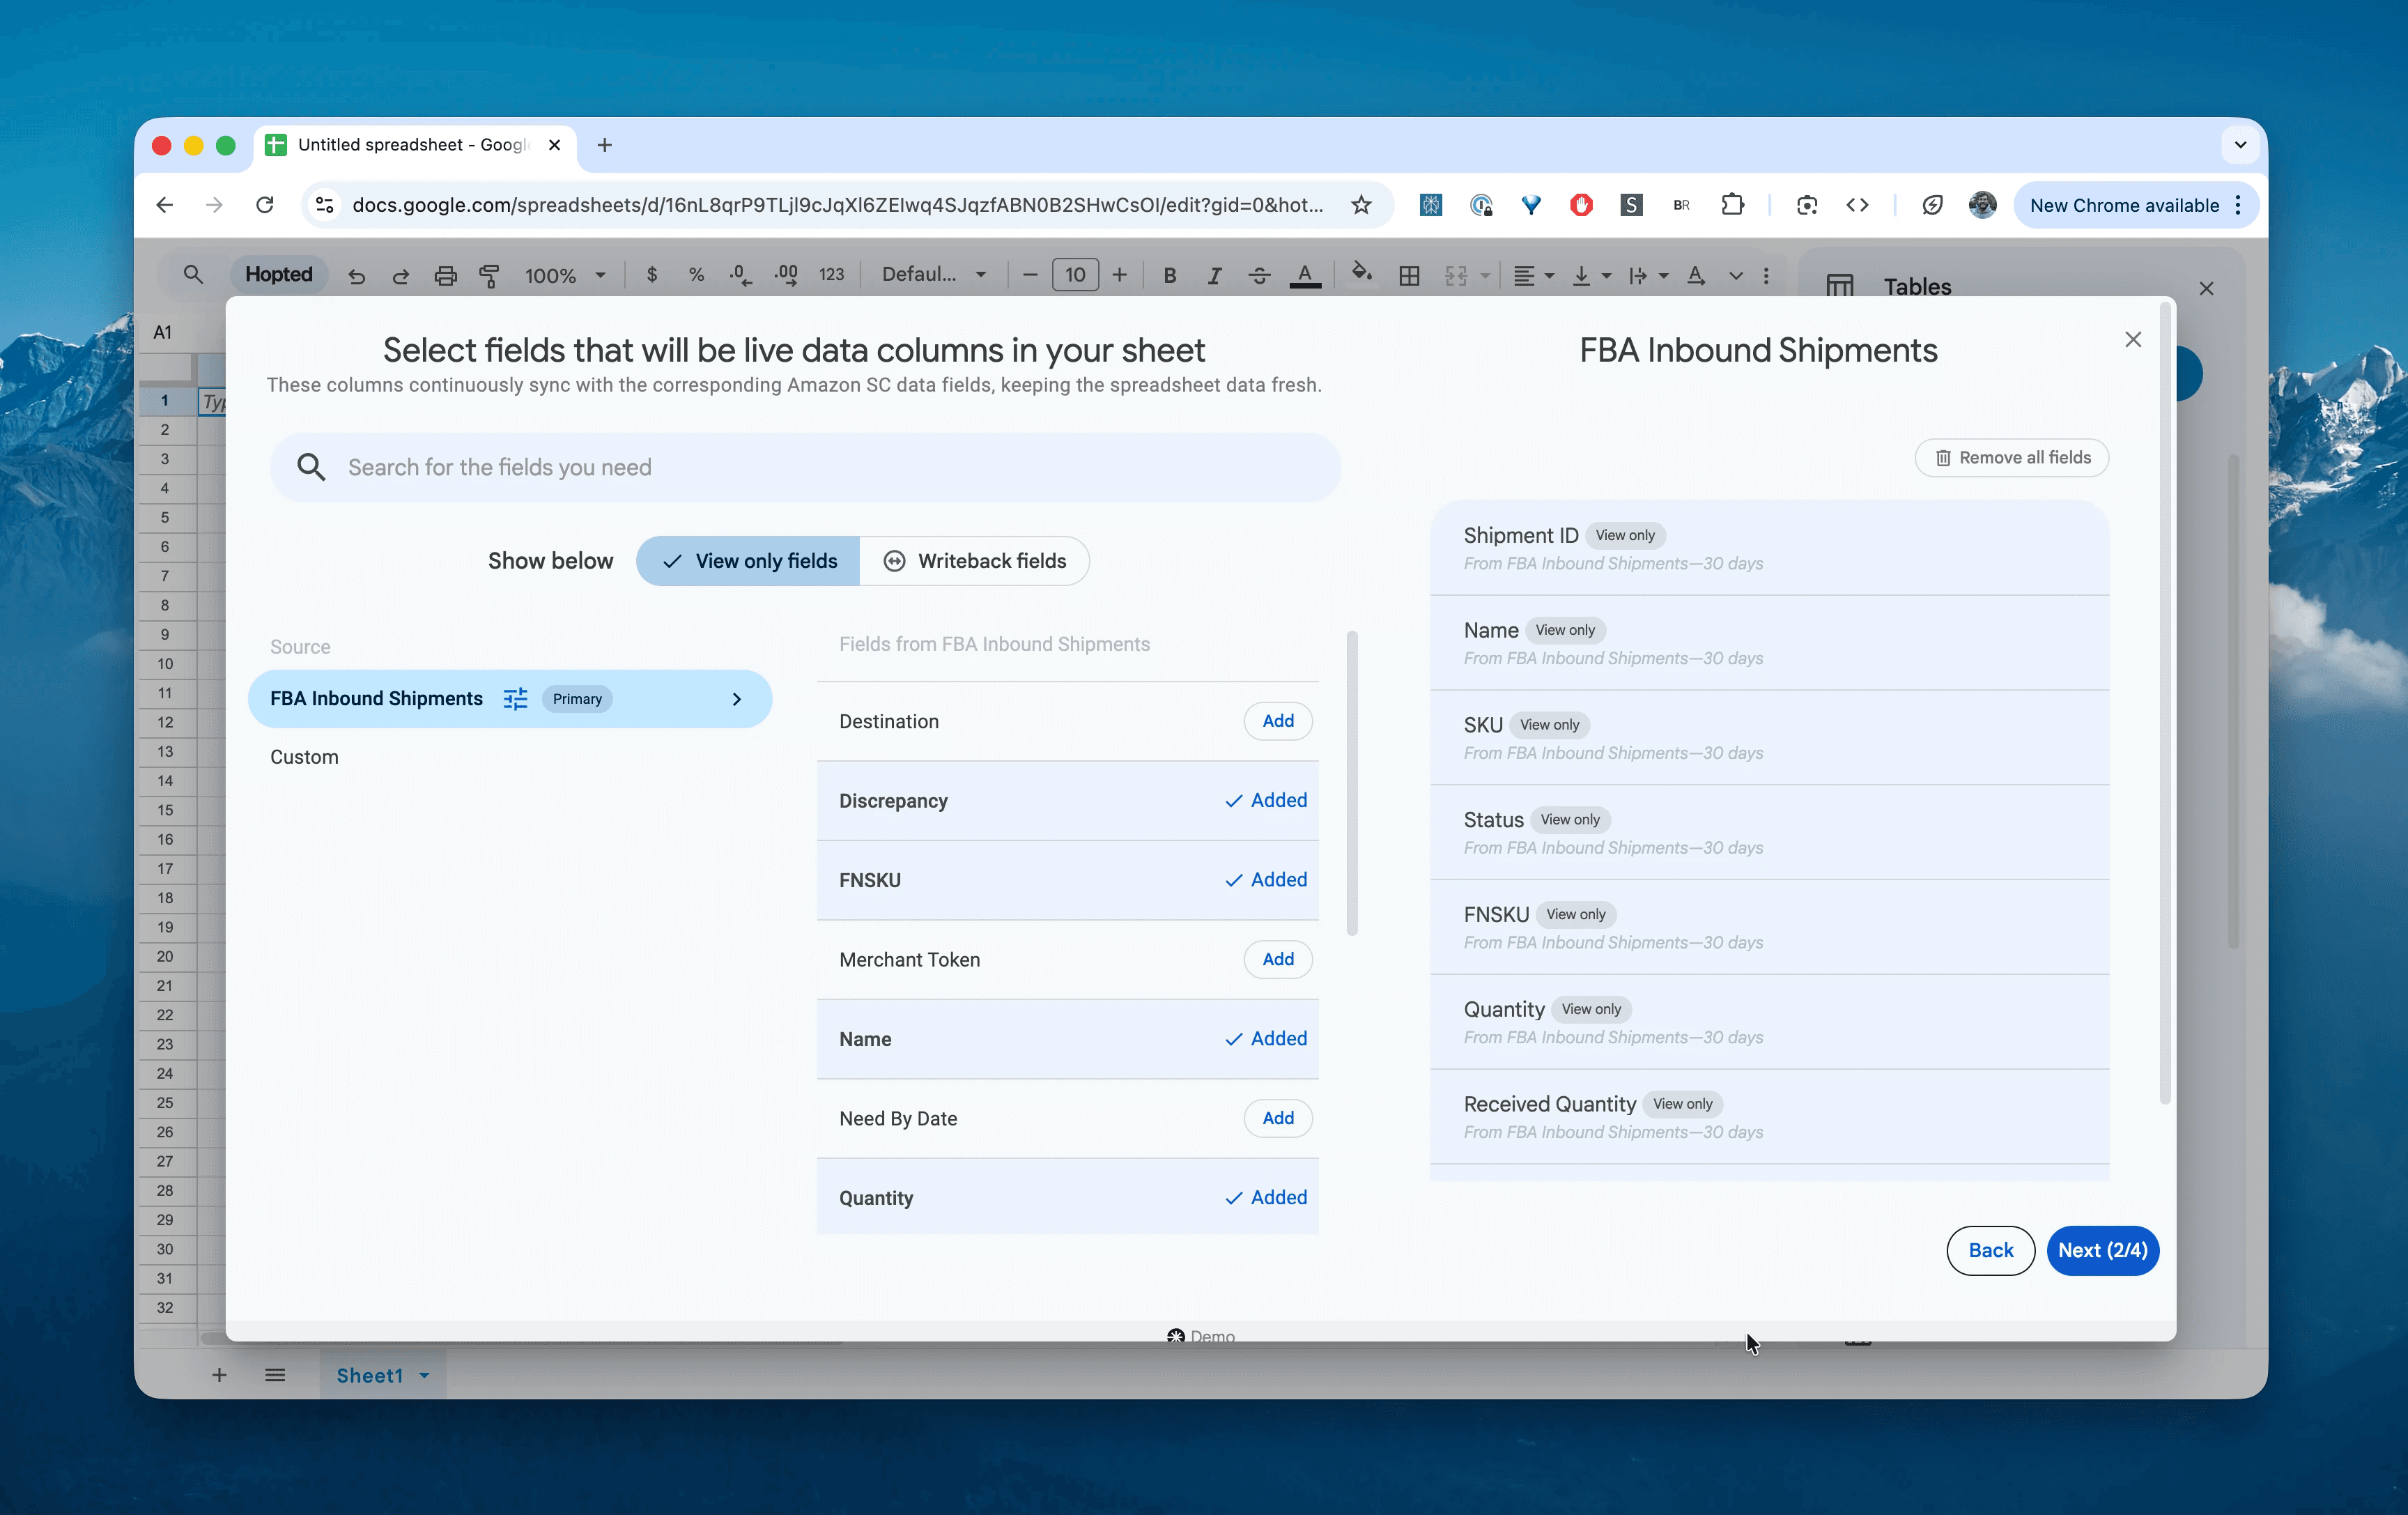
Select columns that you need: Shipment ID, Name, Status, SKU, FNSKU, Quantity (Shipped), Received Quantity, Discrepancy, Destination, Region, Need By Date, and Store name.
Step 5.
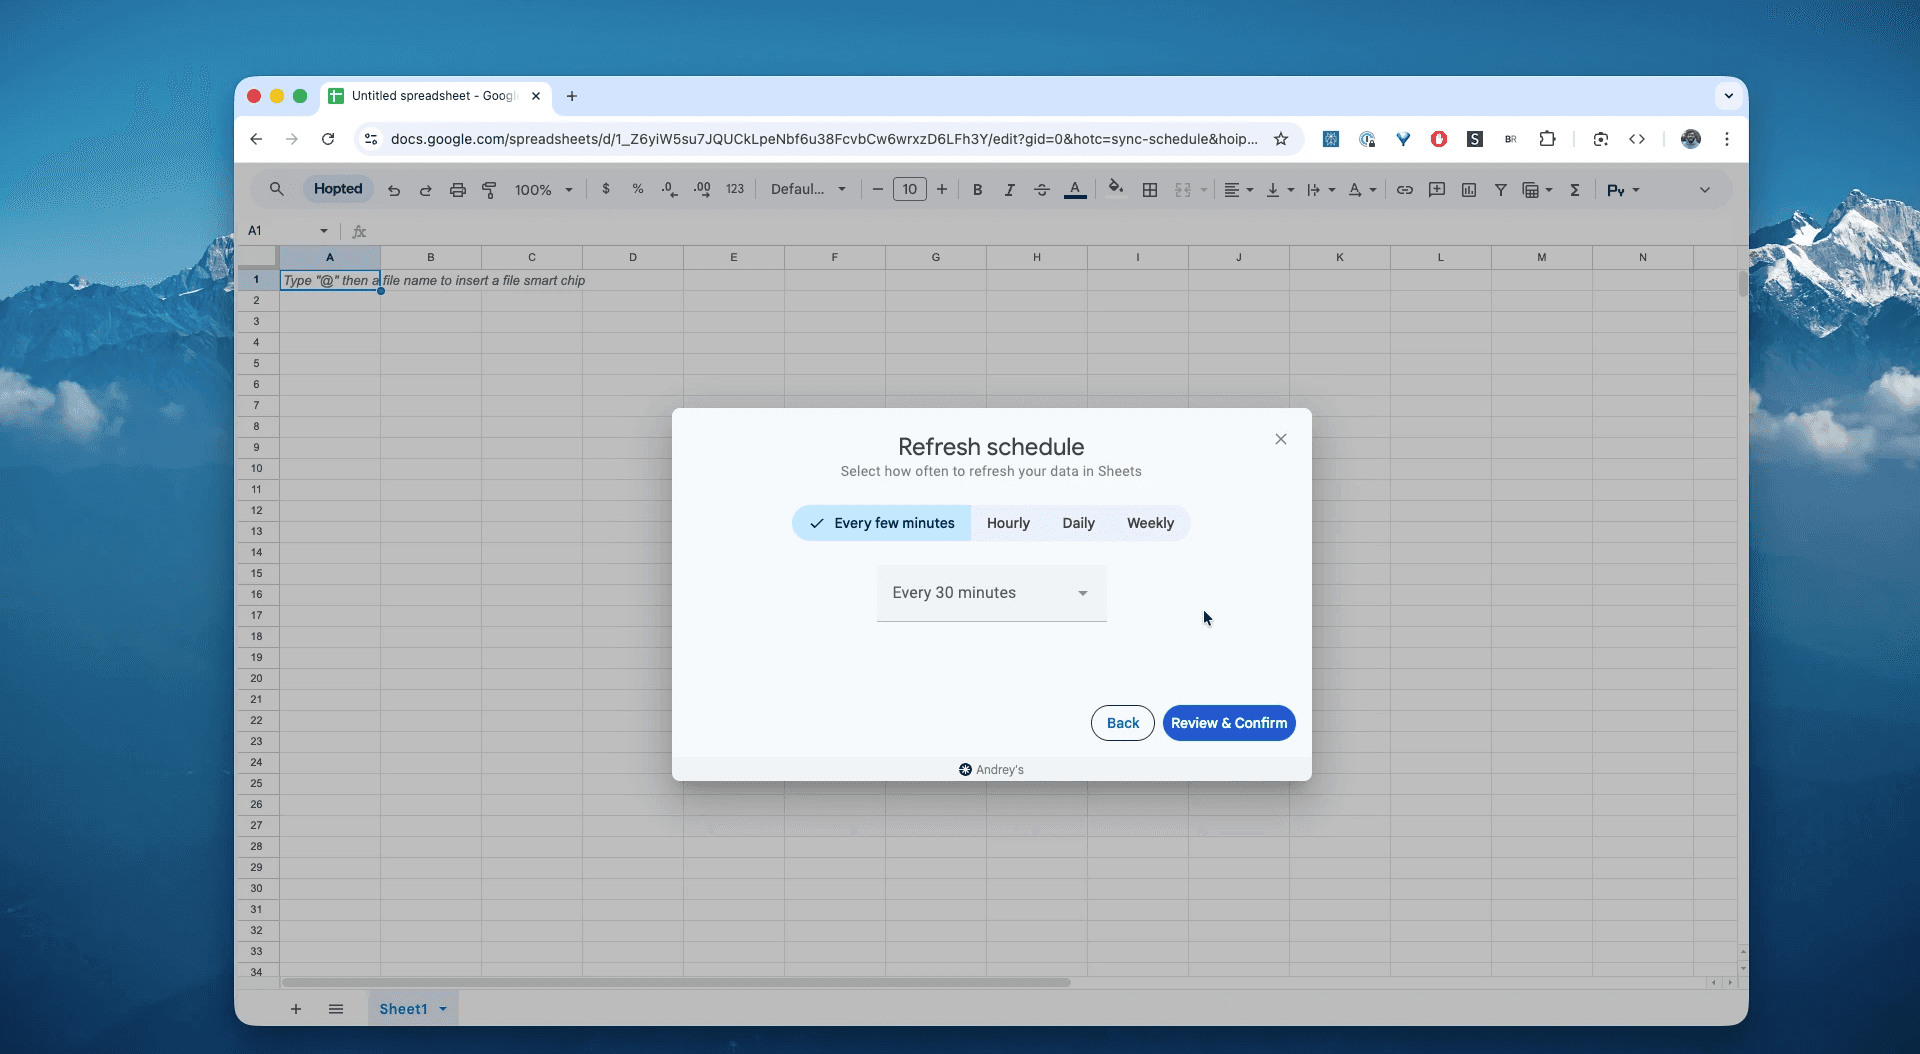
Set your schedule. Choose how often you want to export and refresh your inbound shipment data—every hour, every day, or less frequently. We recommend a Daily schedule to catch status changes from "Working" to "Received" promptly.
Step 6.
Save your data pipeline. This will export your FBA shipment data from Seller Central into spreadsheets instead of dealing with static CSV downloads. Your inbound logistics data will be up to date forever.
What is the Amazon FBA Inbound Shipments Report?
This report is the operational log of every shipment plan you create to send inventory to Amazon. Unlike the Inbound Performance report (which focuses on defects and coaching), the Inbound Shipments report focuses on logistics and reconciliation. It tracks the lifecycle of your inventory from the moment you create a shipping plan until Amazon closes the shipment.
It provides the essential data needed to reconcile what you sent versus what Amazon received, making it the single source of truth for answering questions like:
Which shipments have discrepancies (shortages or overages)?
What is the current status of my restocking orders (Working, Shipped, In-Transit, Delivered, Checked-In, Receiving, Closed)?
How many units are currently inbound for a specific SKU?
Which fulfillment centers (Destination) are my shipments assigned to?
Are my shipments arriving by their "Need By Date"?
How to Analyze & Track Your FBA Inbound Shipments in Spreadsheets
Now that you have a live feed, you can move from data entry to data analysis. This is the real power of analyzing your Amazon Seller Central data in spreadsheets and building your Amazon excel-like template.
Here are 3 Amazon spreadsheet template ideas you can build immediately:
Template 1: The "Missing Units" Reconciliation Tracker
This is the most critical financial use case. It instantly highlights shipments where Amazon received fewer units than you sent, allowing you to open investigation cases before the window closes.
How to build it: Create a Pivot Table or use a simple Filter.
Rows:
Shipment IDandName.Columns:
SKU.Values: Sum of
Discrepancy(or calculateReceived QuantityminusQuantity).Filter: Filter for
Status= "CLOSED" andDiscrepancy< 0.What it shows you: A prioritized list of closed shipments where you are missing inventory. If you see a "-10" for a shipment that is Closed, you know exactly where to file a claim.
Template 2: The "Inbound Pipeline" Dashboard
Stop guessing how much stock is on the way. This view gives you a live count of inventory that is incoming but not yet sellable.
How to build it: Create a Pivot Table.
Rows:
SKUorFNSKU.Columns:
Status(Group into buckets: "Working", "Shipped", "Receiving").Values: SUM of
Quantity.What it shows you: The total number of units currently in the "pipeline" for each product. You can compare this against your sales velocity to determine if you need to rush a new order or if you're overstocked.
Template 3: Destination & Region Analysis
Understand where Amazon is distributing your inventory to optimize your shipping costs and placement settings.
How to build it: Create a Pivot Table.
Rows:
RegionandDestination(Fulfillment Center ID).Values: SUM of
Quantityand COUNT ofShipment ID.What it shows you: A breakdown of your logistics footprint. Are 80% of your shipments going to the West Coast? This data helps you validate your Inventory Placement settings and negotiate better rates with carriers based on your most frequent destinations.
Common workflows this report unlocks
Shipment Reconciliation: Automatically detect closed shipments with negative discrepancies to maximize reimbursement claims for lost inventory.
3PL & Prep Center Auditing: Verify that your logistics partners or prep centers are shipping the exact quantities they invoice you for by comparing their packing lists against Amazon's
Received Quantity.Inventory Planning: Monitor
In-transitandWorkinginventory levels to avoid over-ordering during restocking cycles.Carrier Performance Tracking: Track the time gap between
ShippedandDeliveredstatuses to evaluate carrier efficiency and delivery times.
FAQ about FBA Inbound Shipments Report
Q: What is the difference between this report and the "Inbound Performance" report?
A: The Inbound Shipmentsreport tracks logistics (quantities, status, destinations). The Inbound Performance report tracks compliance (missing labels, safety issues, packaging defects). You use Shipments to track stock, and Performance to track health metrics.
Q: Why does the "Received Quantity" change over time?
A: As Amazon processes your shipment, the status moves from "Checked-In" to "Receiving" to "Closed." During the "Receiving" phase, the count will increase incrementally as units are scanned. You should typically wait until the status is "Closed" before reconciling final numbers.
Q: Can I see the "Need By Date" for my shipments?
A: Yes, Hopted pulls the Need By Date field, which is critical for seasonal items or time-sensitive promotions, helping you ensure your stock arrives on time.
Q: How do I handle discrepancies shown in this report?
A: If the report shows a negative discrepancy (Shortage) on a "Closed" shipment, you should cross-reference this with the Inventory Ledger report to confirm the receipt events, and then open a case with Amazon Seller Support using the Shipment ID provided in this report.
Q: Does this report support multiple stores?
A: Yes, the report includes the Store name and Merchant Token fields, allowing you to aggregate inbound logistics for multiple Amazon accounts into a single spreadsheet.
Q: How is Hopted different from other Amazon seller software?
A: Most Amazon tools force you into their rigid dashboards and pre-built reports. You have to change your workflow to fit their software. With Hopted is the opposite. It’s a flexible data automation layer that works directly inside your existing spreadsheets (like Google Sheets). Instead of forcing you to learn a new system, Hopted brings all your scattered Amazon data (sales, inventory, orders, etc.) right to you. You can build the fully custom reports and automations you need, not the ones a rigid tool dictates.


Hopted,
explained.
Watch the film