The FBA Inventory page/report is your live snapshot of on-hand stock—sellable, unsellable, reserved, and inbound pipeline (working/shipped/receiving)—by SKU/ASIN/FNSKU and location, built to guide restock, excess/aged cleanup, and capacity hygiene. This guide shows you how to stop the manual "download, check, repeat" cycle. We'll cover how to automatically pull your FBA Inventory report directly into Google Sheets on an hourly or daily schedule.

How to Automatically Sync & Import the FBA Inventory Report to Google Sheets (The Hopted Way)
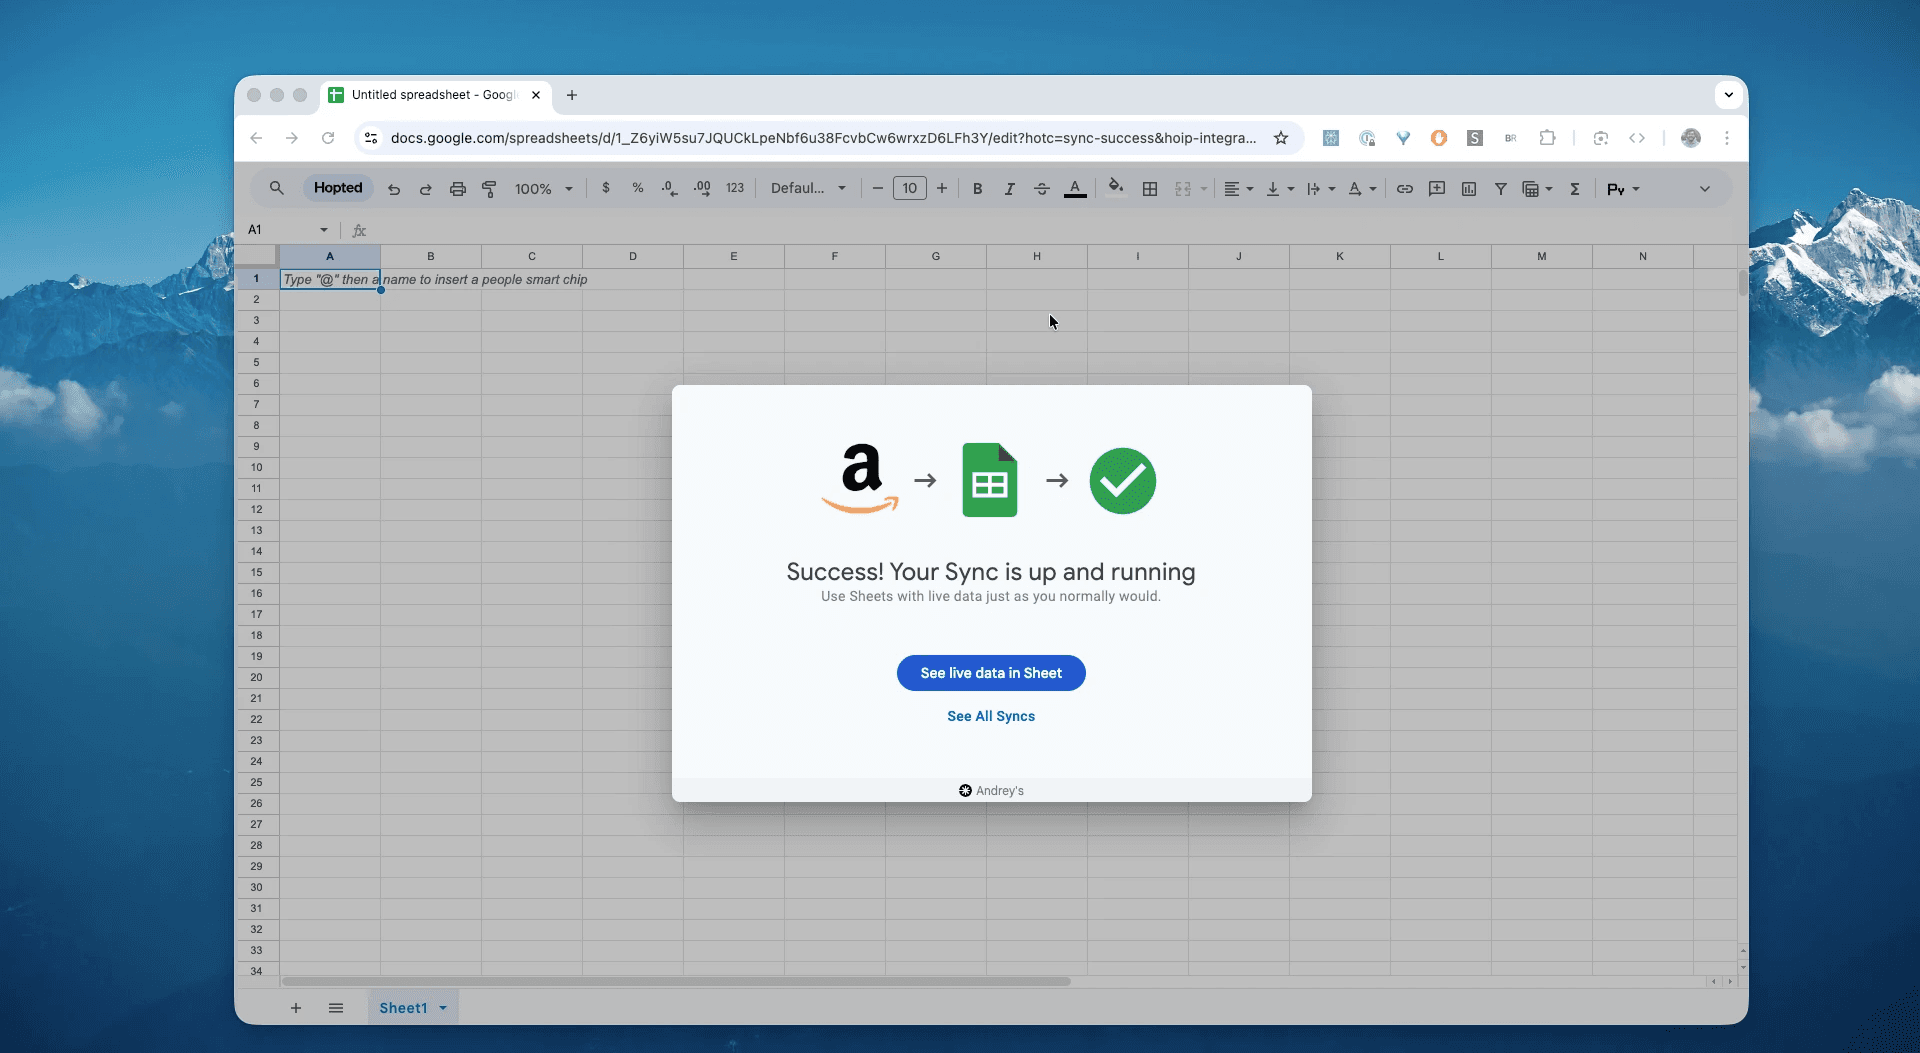
Using an Amazon to Google Sheets integration like Hopted, you set up the connection once, and your data flows automatically.
Step 1.
Install the Hopted browser extension and sign in using your Google Account.
Step 2.
Securely connect your Amazon Seller Central to Google Sheets using Hopted's integration wizard.
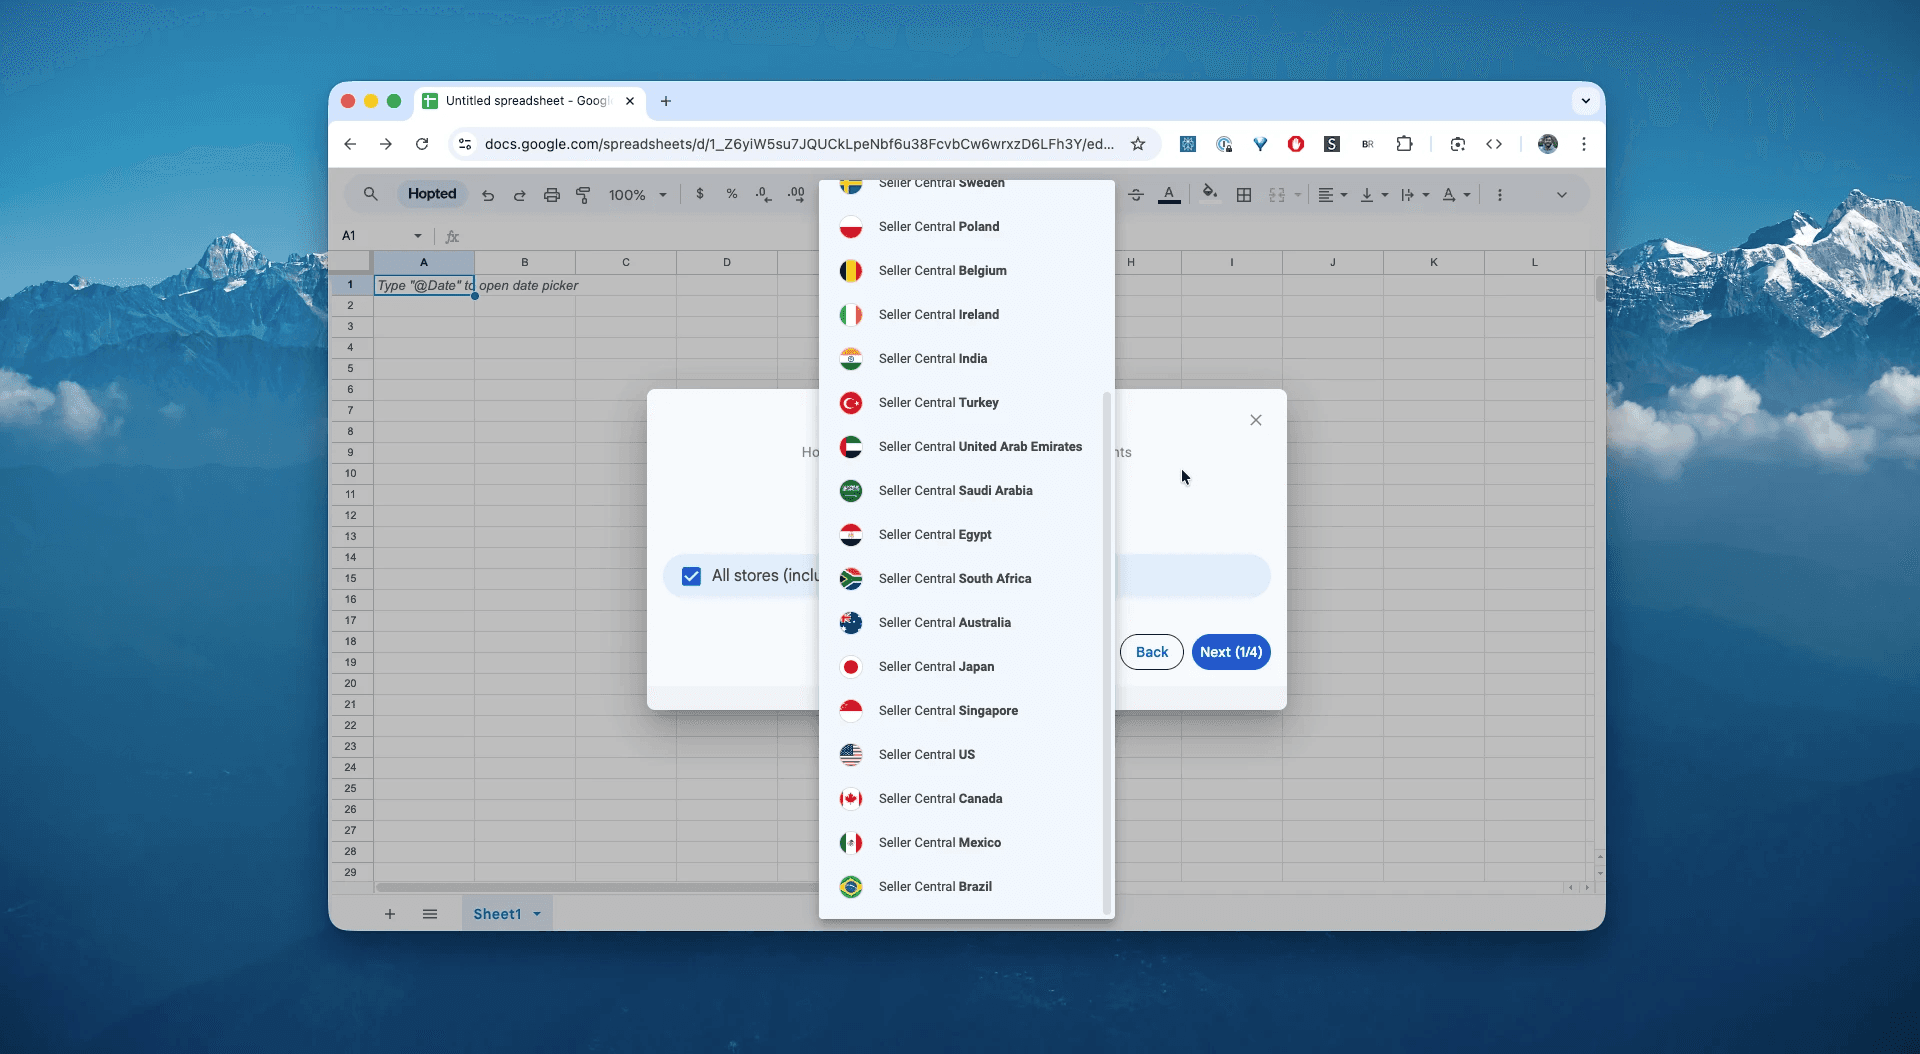
Step 3.
In Google Sheets, from the list of available Amazon Seller Central reports, select "FBA Inventory" report.
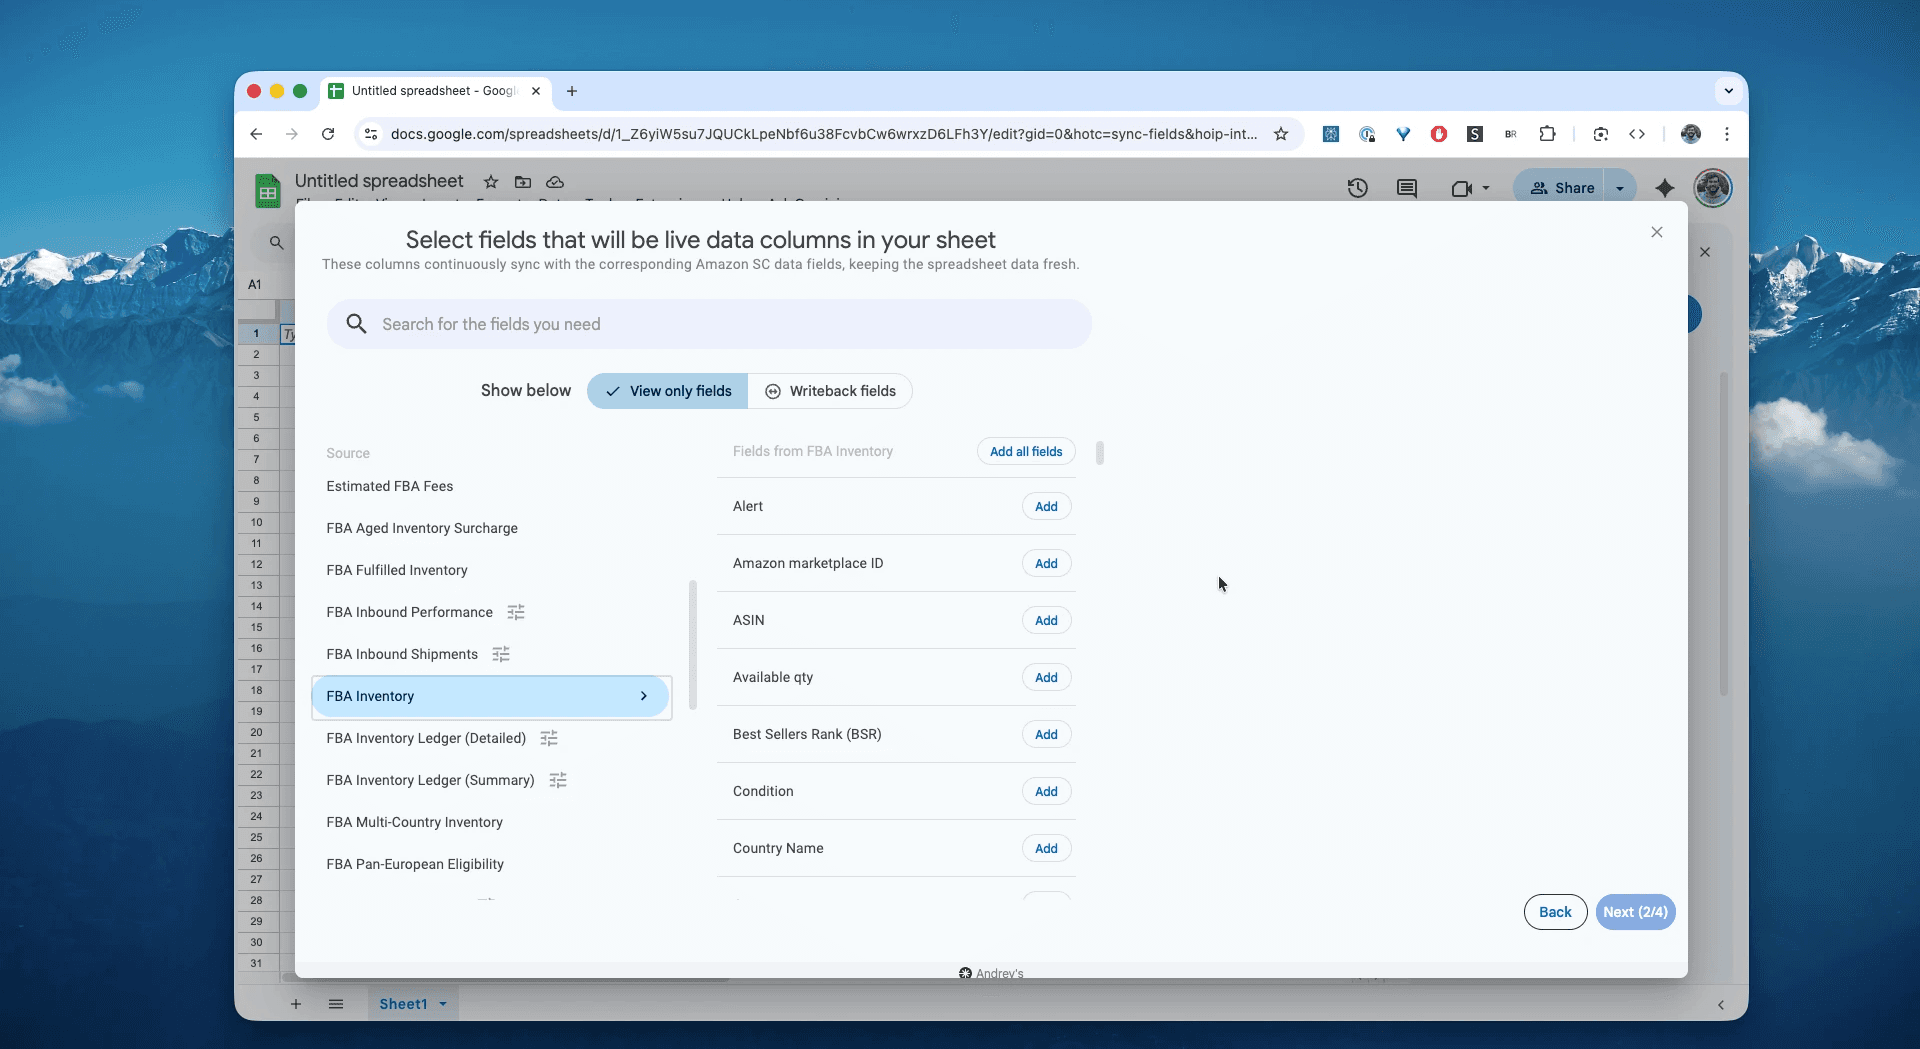
Step 4.
Select columns that you need: ASIN, SKU, Available qty, Reserved qty, Inbound qty, Recommended action, alert, and other fields.
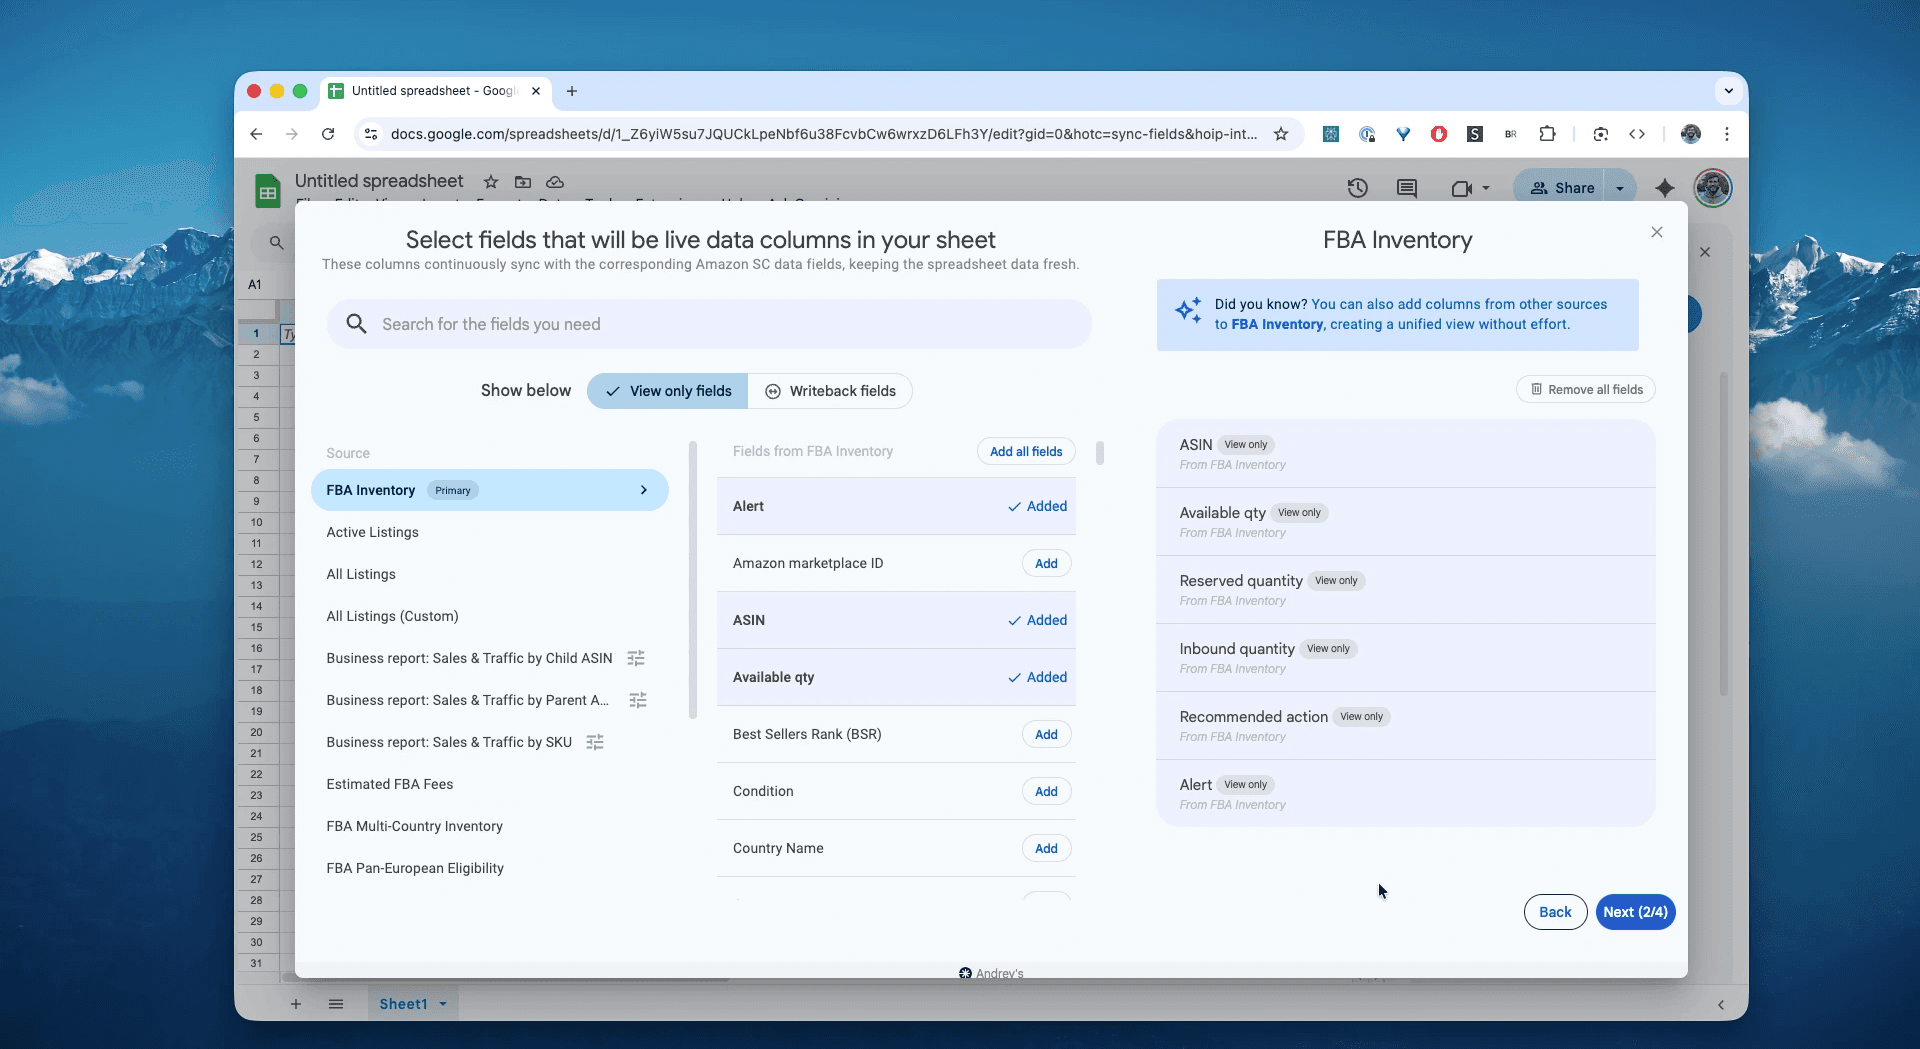
Step 5.
Set your schedule. Choose how often you want to export and refresh your FBA inventory—every hour, every day, or less frequent.
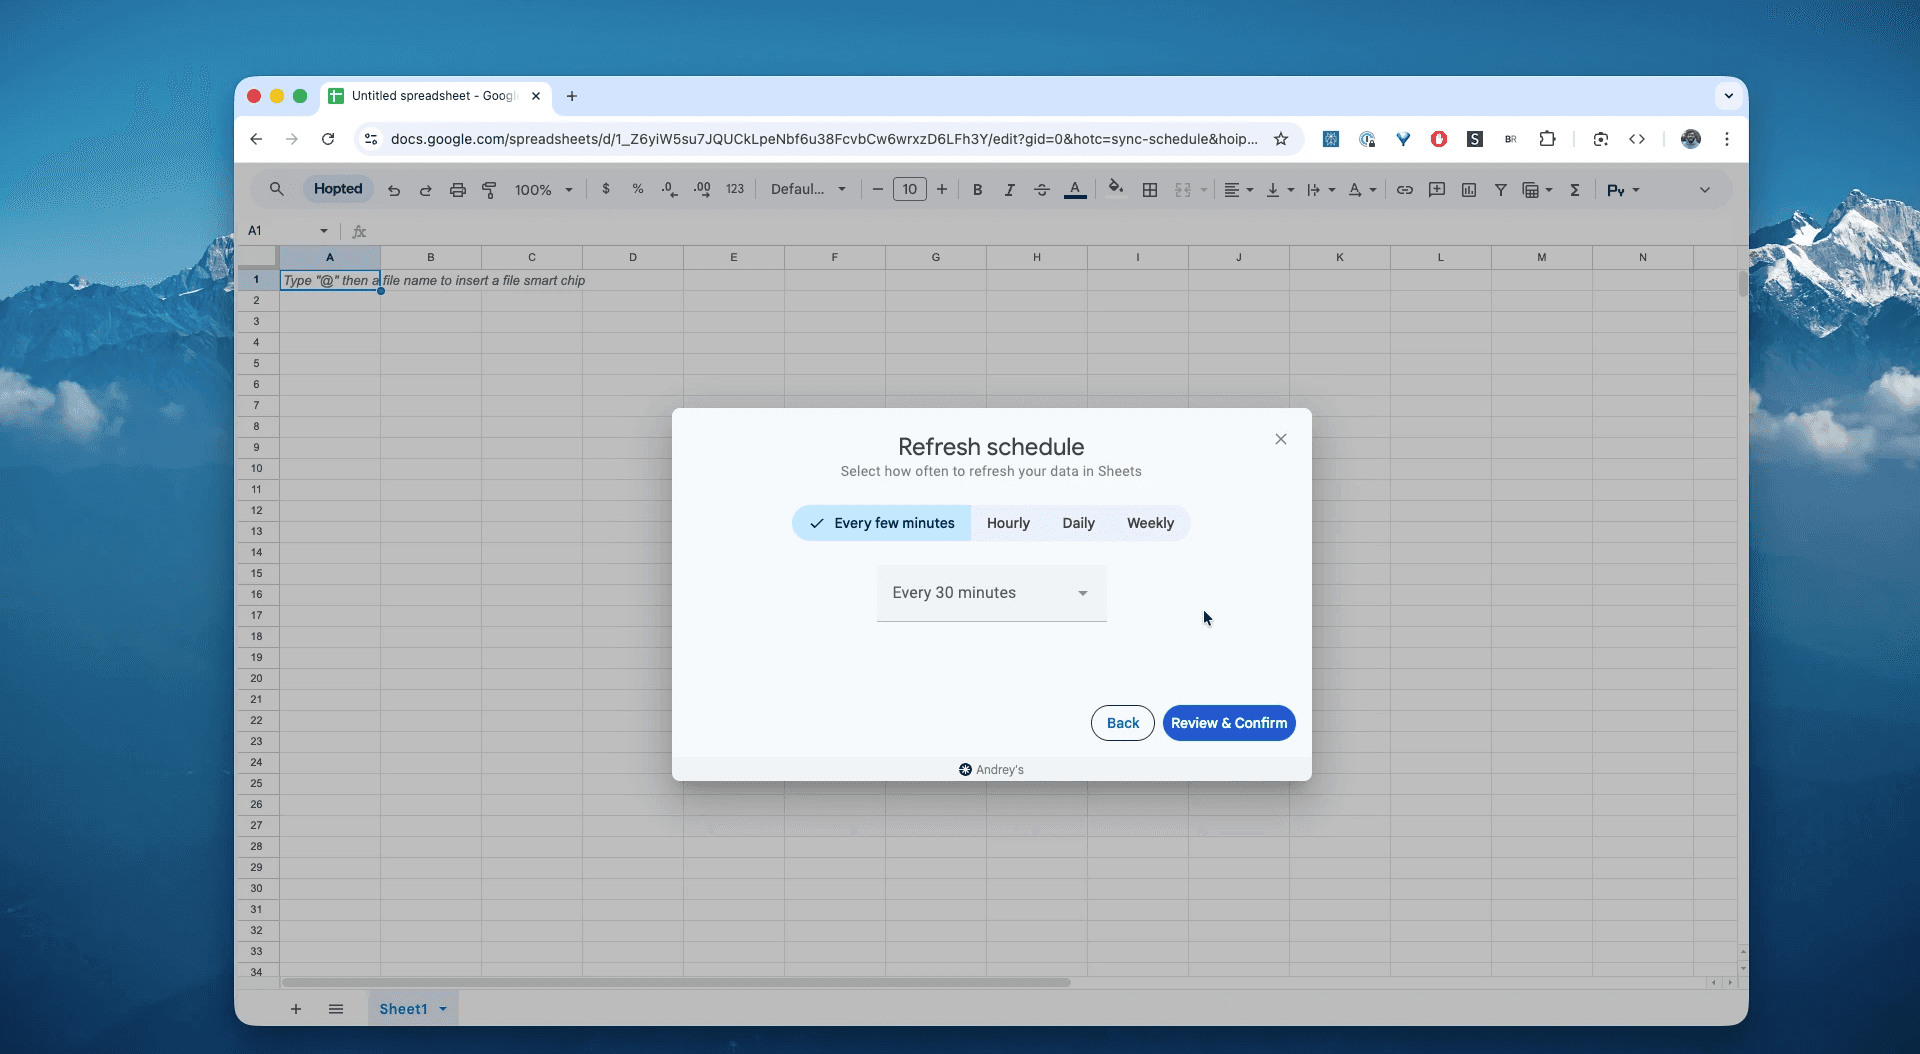
Step 6.
Save your data pipeline. This will export your Amazon inventory from Seller Central into spreadsheets instead of dealing with CSVs. The FBA inventory in your spreadsheets will be up to data forever.
What is the Amazon FBA Inventory Report?
This report enables you to manage your restock, excess, aged and unfulfillable inventory and maintain healthy inventory levels from a single location. Additionally, they allow you to assess fees, monitor critical factors such as your ASIN sales performance, optimize pricing, and maintain healthy IPI score by utilizing your capacity at Amazon's fulfillment centers more efficiently. Below is a list of metrics included in the FBA Inventory report to help you plan your inventory
Seven-day, 30-day, 60-day, and 90-day sales and units shipped
Your list prices
Shipment quantities: working, shipped, and receiving
Build a Live Restocking Dashboard: This is the #1 reason. You can analyze your Amazon data by combining your
Availablequantity with your 30-day sales velocity. This allows you to automatically calculate "Days of Cover" so you know exactly when to reorder.Create a Master Inventory View: Pull all your Amazon reports into one Google Sheet. You can have this FBA Inventory snapshot on one tab, your FBA Sales report on another, and your Inventory Ledger on a third for a complete business overview.
Track Unsellable & Stranded Stock: Stop discovering damaged units by surprise. A live-synced sheet allows you to build a dashboard that immediately flags any ASIN where
Unfulfillablequantity is greater than zero, so you can create a removal order.Monitor Inventory Age: Create rules to automatically highlight inventory approaching long-term storage fee (LTSF) dates, saving you thousands.
This makes it the single source of truth for answering questions like:
How much stock do I have right now?What do I need to restock?What is my exact sellable (available) quantity?How much of my stock is inbound (on its way to FBA)?How much is unfulfillable (damaged, expired, etc.)?How many units are reserved (customer orders vs FC processing vs transfers) and when will they free up?What is the age of my inventory (for avoiding storage fees)?
How to Analyze & Track Your FBA Inventory in Spreadsheets
Now that you have a live feed, you can move from data entry to data analysis. This is the real power of analyzing your Amazon Seller Central data in spreadsheets and building your Amazon excel-like template.
Here are 3 Amazon spreadsheet template ideas you can build immediately:
Template 1: The "Days of Cover" Restocking Calculator
This is the ultimate tool for preventing stockouts.
How to build it: In your sheet, you'll have the Available quantity (Column B) synced from Hopted. In the next column (Column C), manually enter (or pull from another report) the "30-Day Sales Velocity" for that ASIN.
Formula: In Column D, add the formula:
=B2 / (C2 / 30)What it shows you: This formula calculates your "Days of Cover." You can add conditional formatting to turn the cell red if the number drops below 15, giving you an impossible-to-miss visual cue to reorder.
Template 2: The "At-Risk Inventory" Monitor
This dashboard helps you track your Amazon data to protect your cash flow.
How to build it: Create a new tab that summarizes your main data sheet.
Cell A1:
Total Unfulfillable ValueFormula:
=SUMIF(Data!E:E, ">0", Data!F:F)(Assuming E isUnfulfillable Qtyand F isYourPrice * Qty)
Cell A2:
SKUs Nearing LTSFFormula:
=COUNTIF(Data!G:G, "181-270 days")(Assuming G is theInventory Agecolumn)
What it shows you: A top-level view of money trapped in unsellable stock and inventory at risk of high storage fees.
Template 3: The "Inbound vs. Available" Tracker
This helps you visualize your full inventory pipeline.
How to build it: Create a simple Stacked Bar Chart in Google Sheets.
Data: Select your
ASINcolumn, yourAvailablecolumn, and yourInboundcolumn.What it shows you: A visual, at-a-glance breakdown for each product, showing what's on-hand and sellable versus what's on its way. This is crucial for managing cash flow and planning promotions.
Common workflows this report unlocks
Replenishment: Know what’s truly sellable vs. tied up in reserved or inbound so you reorder the right amount at the right time.
Ops hygiene: Spot unsellable build-up and aged/excess risk early; trigger removals or rework.
Network awareness: See inventory spread by FC/country to balance stock and reduce splits.
FAQ about Amazon FBA Inventory
Q: What is the scope of this report?
A consolidated inventory snapshot for FBA: quantities available to sell, unsellable, reserved (customer orders, FC processing, transfers), and inbound (working, shipped, receiving). Ideal for replenishment and health monitoring.
Q: How do I get a real-time view of my FBA inventory in a spreadsheet?
Amazon doesn't provide a real-time "push" service. The best solution is to use an Amazon to Google Sheets integrationlike Hopted to pull the FBA Inventory report on a high-frequency schedule, such as every hour. This automatically updates your spreadsheet and is the closest you can get to a live, real-time feed.
Q: What does "Reserved" mean in the FBA Inventory report (customer orders vs FC processing vs transfers)?
“Reserved” splits into pending customer orders, FC processing, and FC transfers; these units aren’t sellable until the status clears.
Q: How is "Inbound" broken down in the Inventory page/report (working, shipped, receiving)?
Working = created but not yet shipped; Shipped = en route; Receiving = at FC being checked in. Track each to predict when inventory becomes available.
Q: How do I calculate Available-to-Promise (ATP) using the FBA Inventory report?
Use Available – SafetyStock, then overlay Inbound Shipped/Receiving to see near-term recoveries; keep Reserved as a separate panel to avoid double counting.
Q: What’s the difference between FBA Inventory vs Inventory Ledger reports?
FBA Inventory = snapshot for planning; Ledger (Detailed/Summary) = movement history for reconciliation and audits. Use both together.
Q: What is the best FBA inventory management spreadsheet template?
The best templates are live templates, not static ones. You can build your own by automating your FBA Inventory report into Google Sheets. Then, add your own formulas (like "Days of Cover") to the sheet. This creates a custom, auto-updating dashboard that is more powerful than any static template. Hopted also provide free FBA spreadsheet template for replenishment.
Q: How do I automate Amazon seller reports to Excel?
While many sellers look for an Excel plugin for Amazon Seller Central, a more modern approach is to use a cloud-first tool. You can use Hopted to pull your Amazon reports into Google Sheets. From there, you can either work in the cloud or use Google's tools to download the auto-updated file as an Excel sheet.
Q: How is Hopted different from other Amazon seller software?
Most Amazon tools force you into their rigid dashboards and pre-built reports. You have to change your workflow to fit their software. With Hopted is the opposite. It’s a flexible data automation layer that works directly inside your existing spreadsheets (like Google Sheets). Instead of forcing you to learn a new system, Hopted brings all your scattered Amazon data (sales, inventory, orders, etc.) right to you. You can build the fully custom reports and automations you need, not the ones a rigid tool dictates.


Hopted,
explained.
Watch the film