The go-to Business Report for child-SKU (MSKU) performance—combining traffic (sessions, page views) with commercials (units, ordered product sales) and merchandising signals (Featured Offer/Buy Box %, Unit Session %). Ideal for diagnosing conversion, Buy Box, and listing issues at the SKU level. We'll cover how to build a live, historical dashboard for your most critical performance indicators directly in Google Sheets.

How to Automatically Sync & Import the Sales & Traffic (by SKU) to Google Sheets (The Hopted Way)
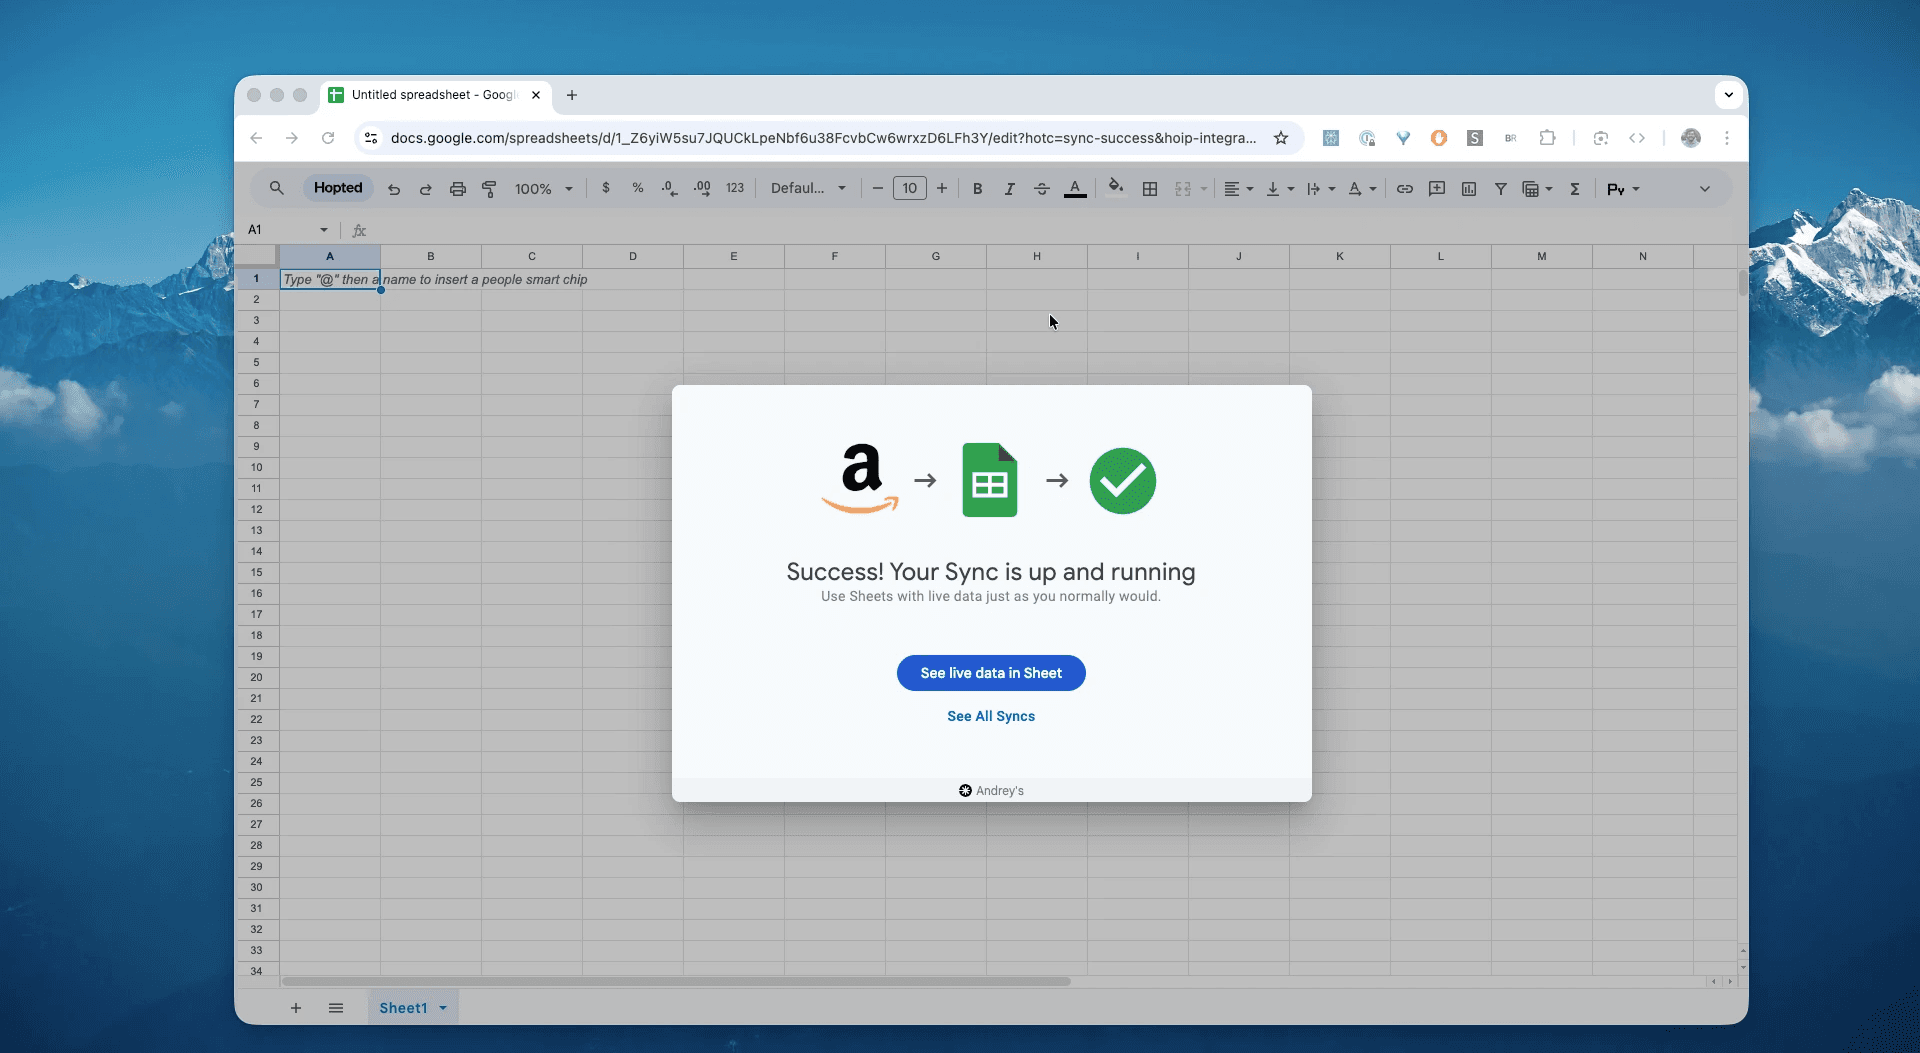
Using an Amazon to Google Sheets integration like Hopted, you set up the connection once, and your data flows automatically.
Step 1.
Install the Hopted browser extension and sign in using your Google Account.
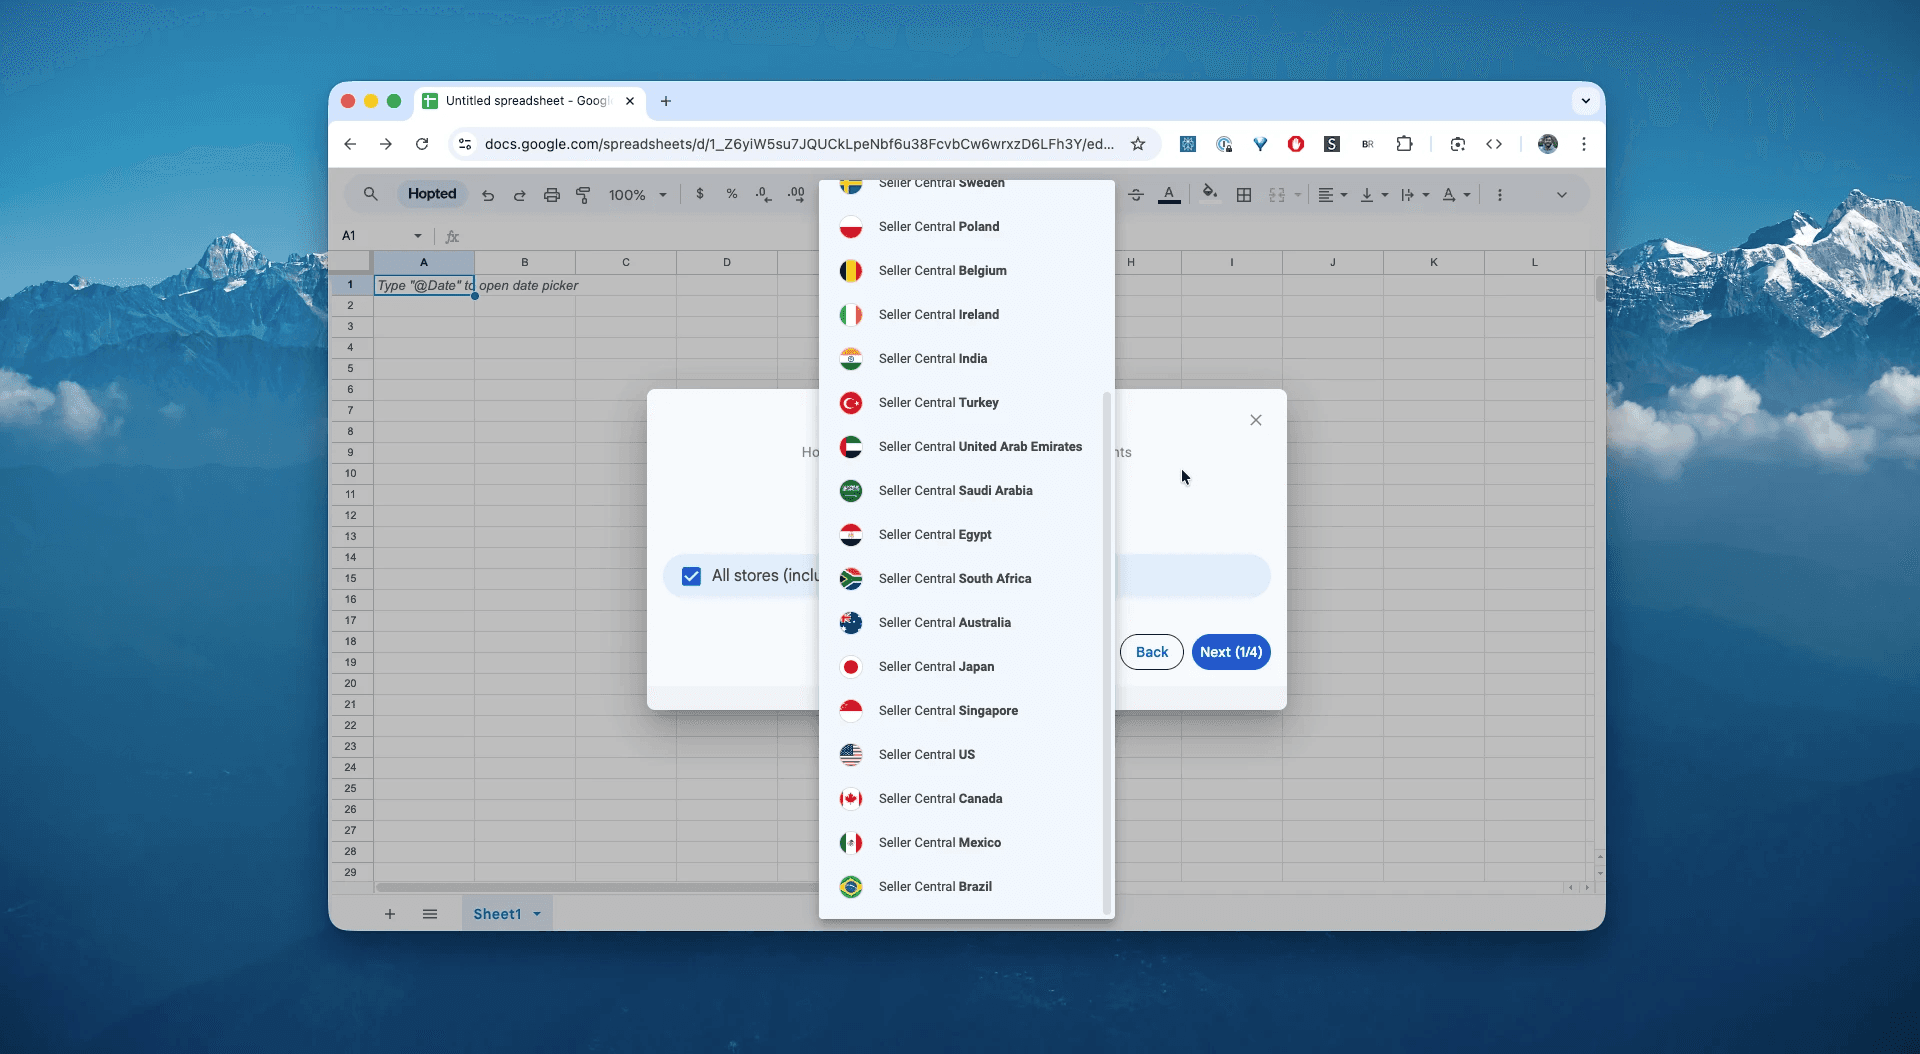
Step 2.
Securely connect your Amazon Seller Central to Google Sheets using Hopted's integration wizard.
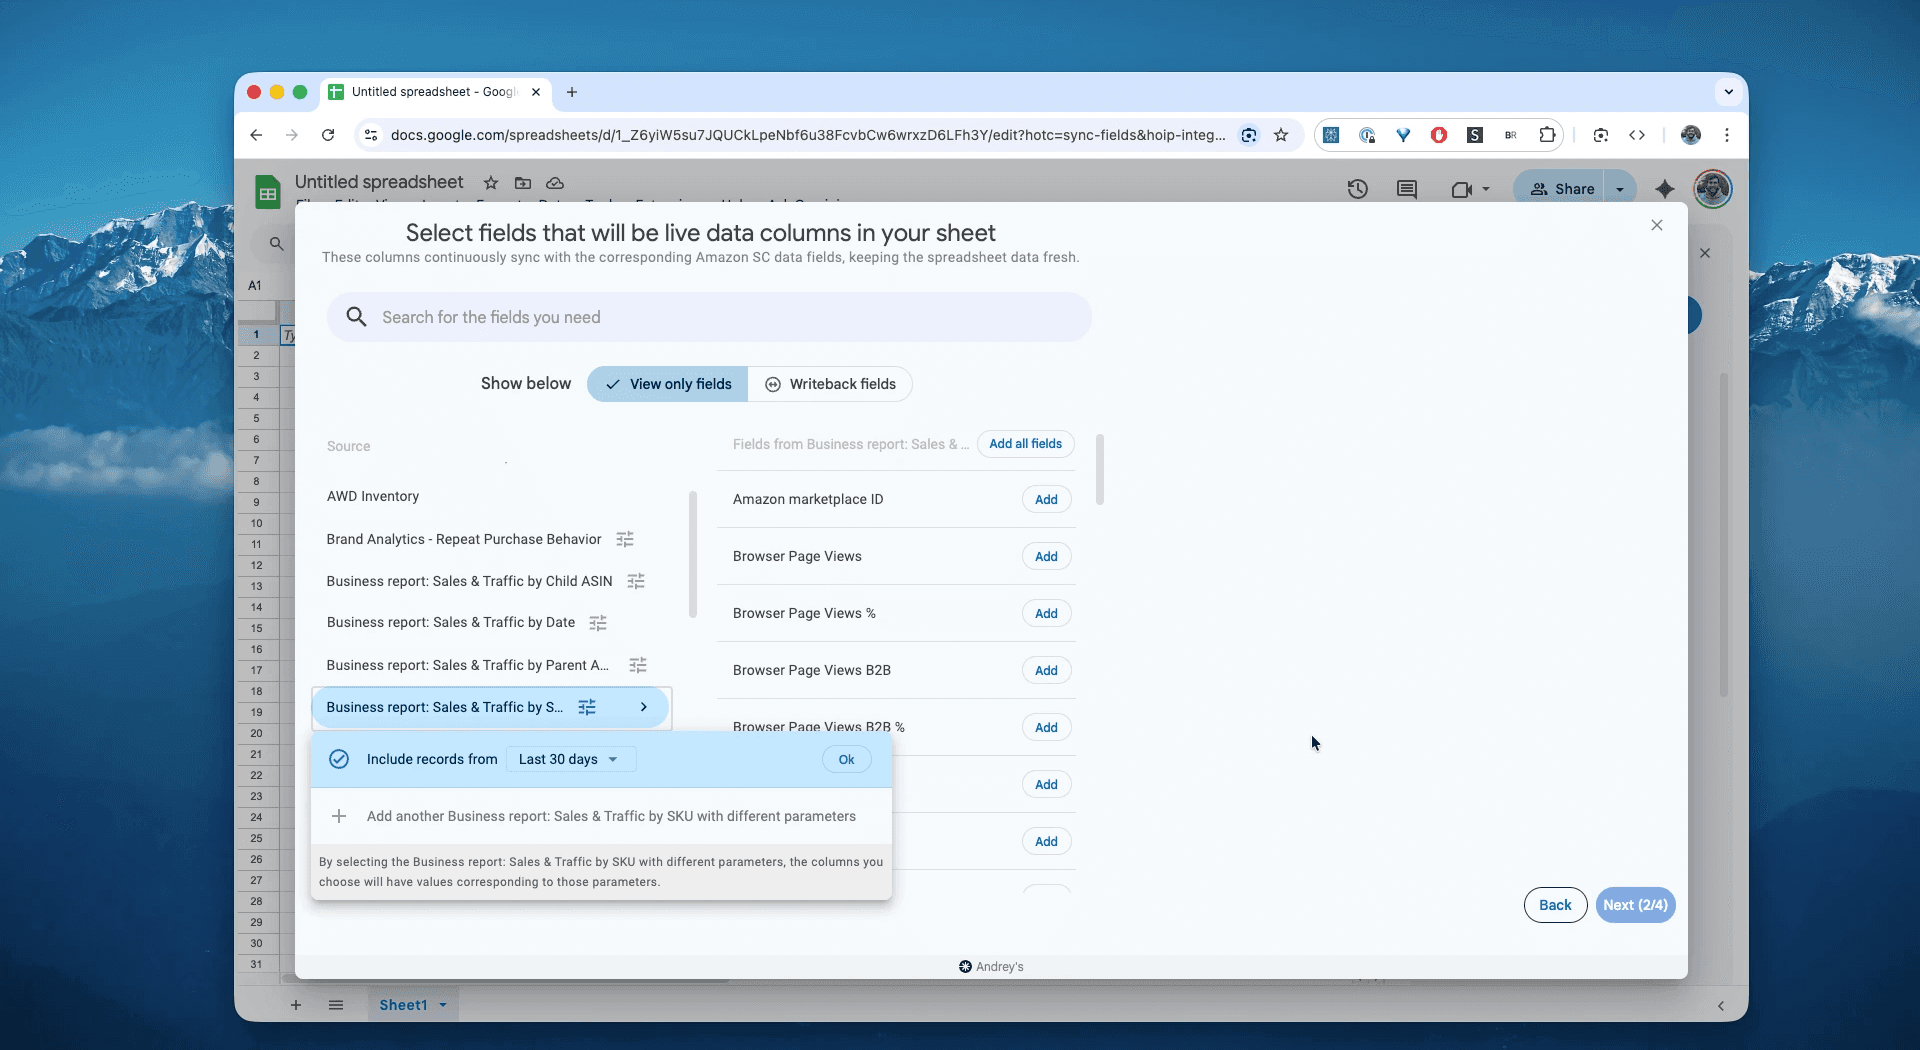
Step 3.
In Google Sheets, from the list of available Amazon Seller Central reports, select "Business report: Sales & Traffic by SKU" for a specific date range. This can be as recent as the "Last 24 hours" or a custom range going as far back as 23 months. For this example, we'll select "Include records for the last 30 days".
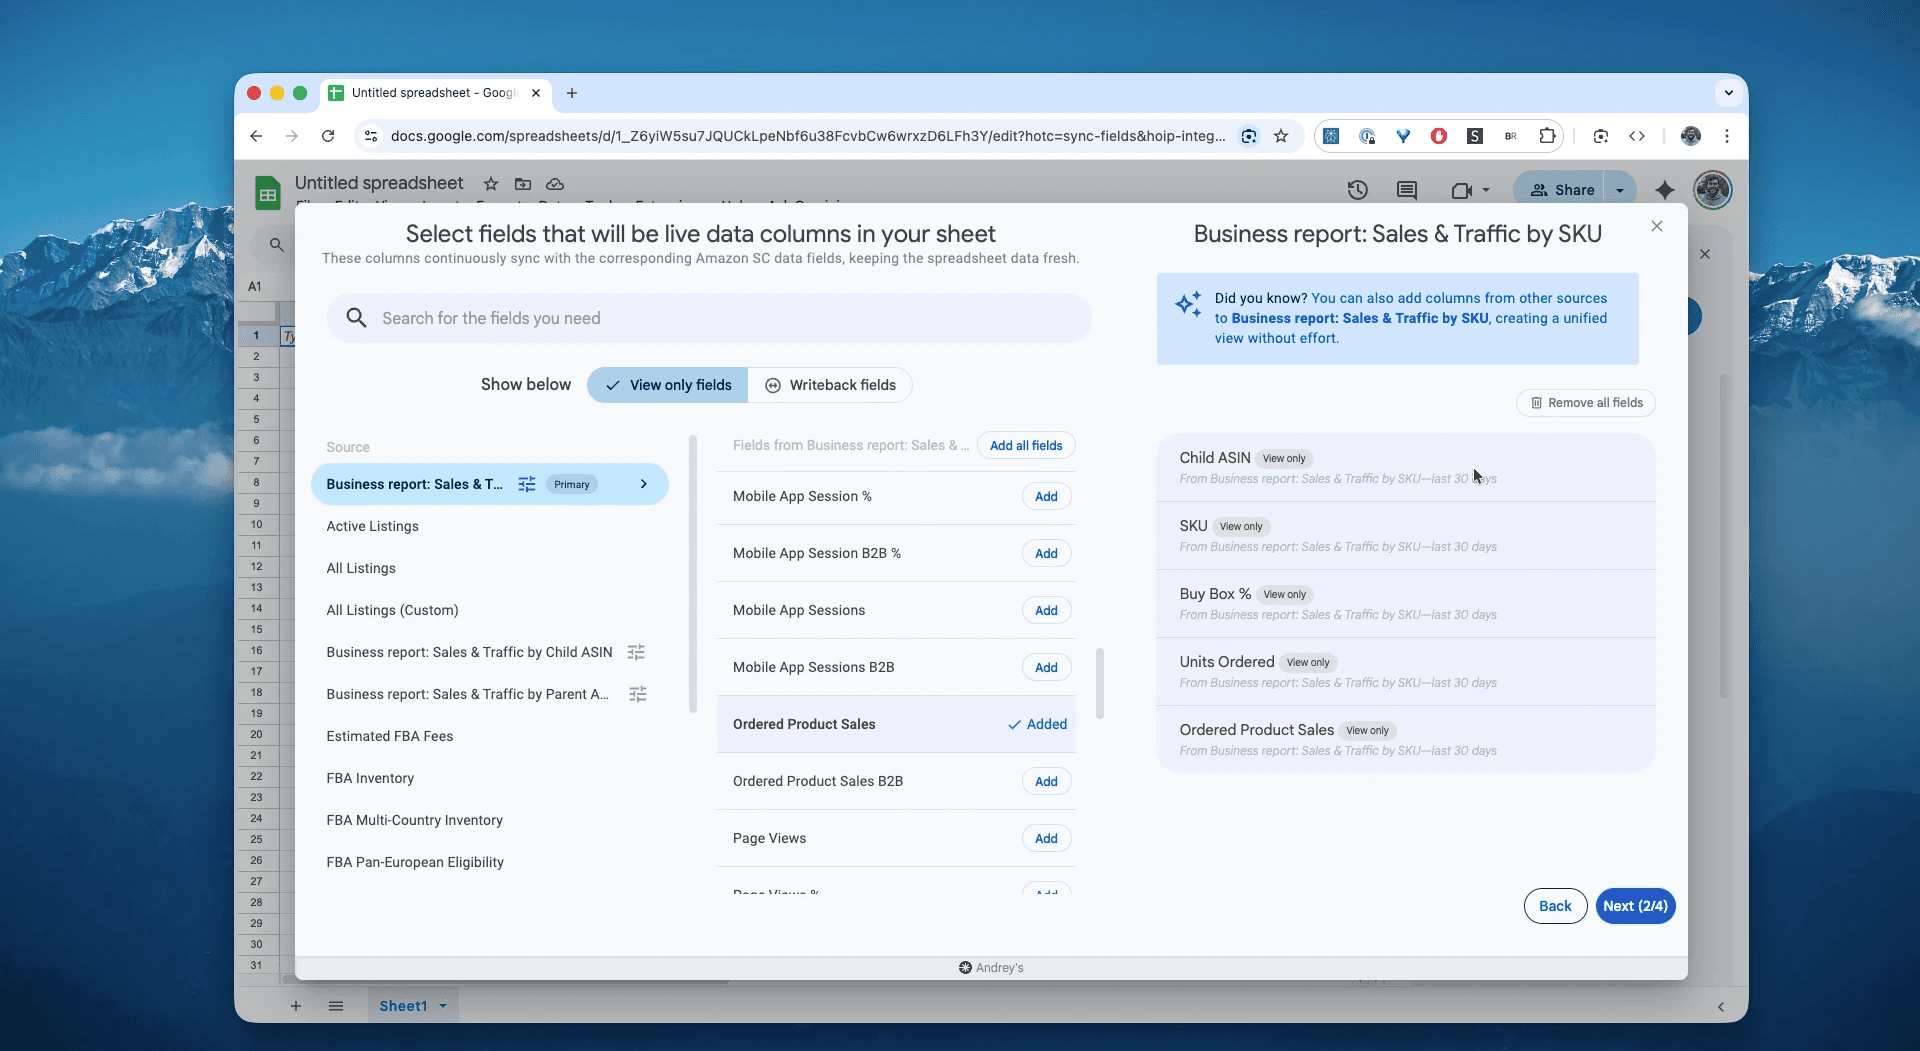
Step 4.
Select columns that you need: SKU, ASIN, units orders, sales and buy box percentage, and other fields.
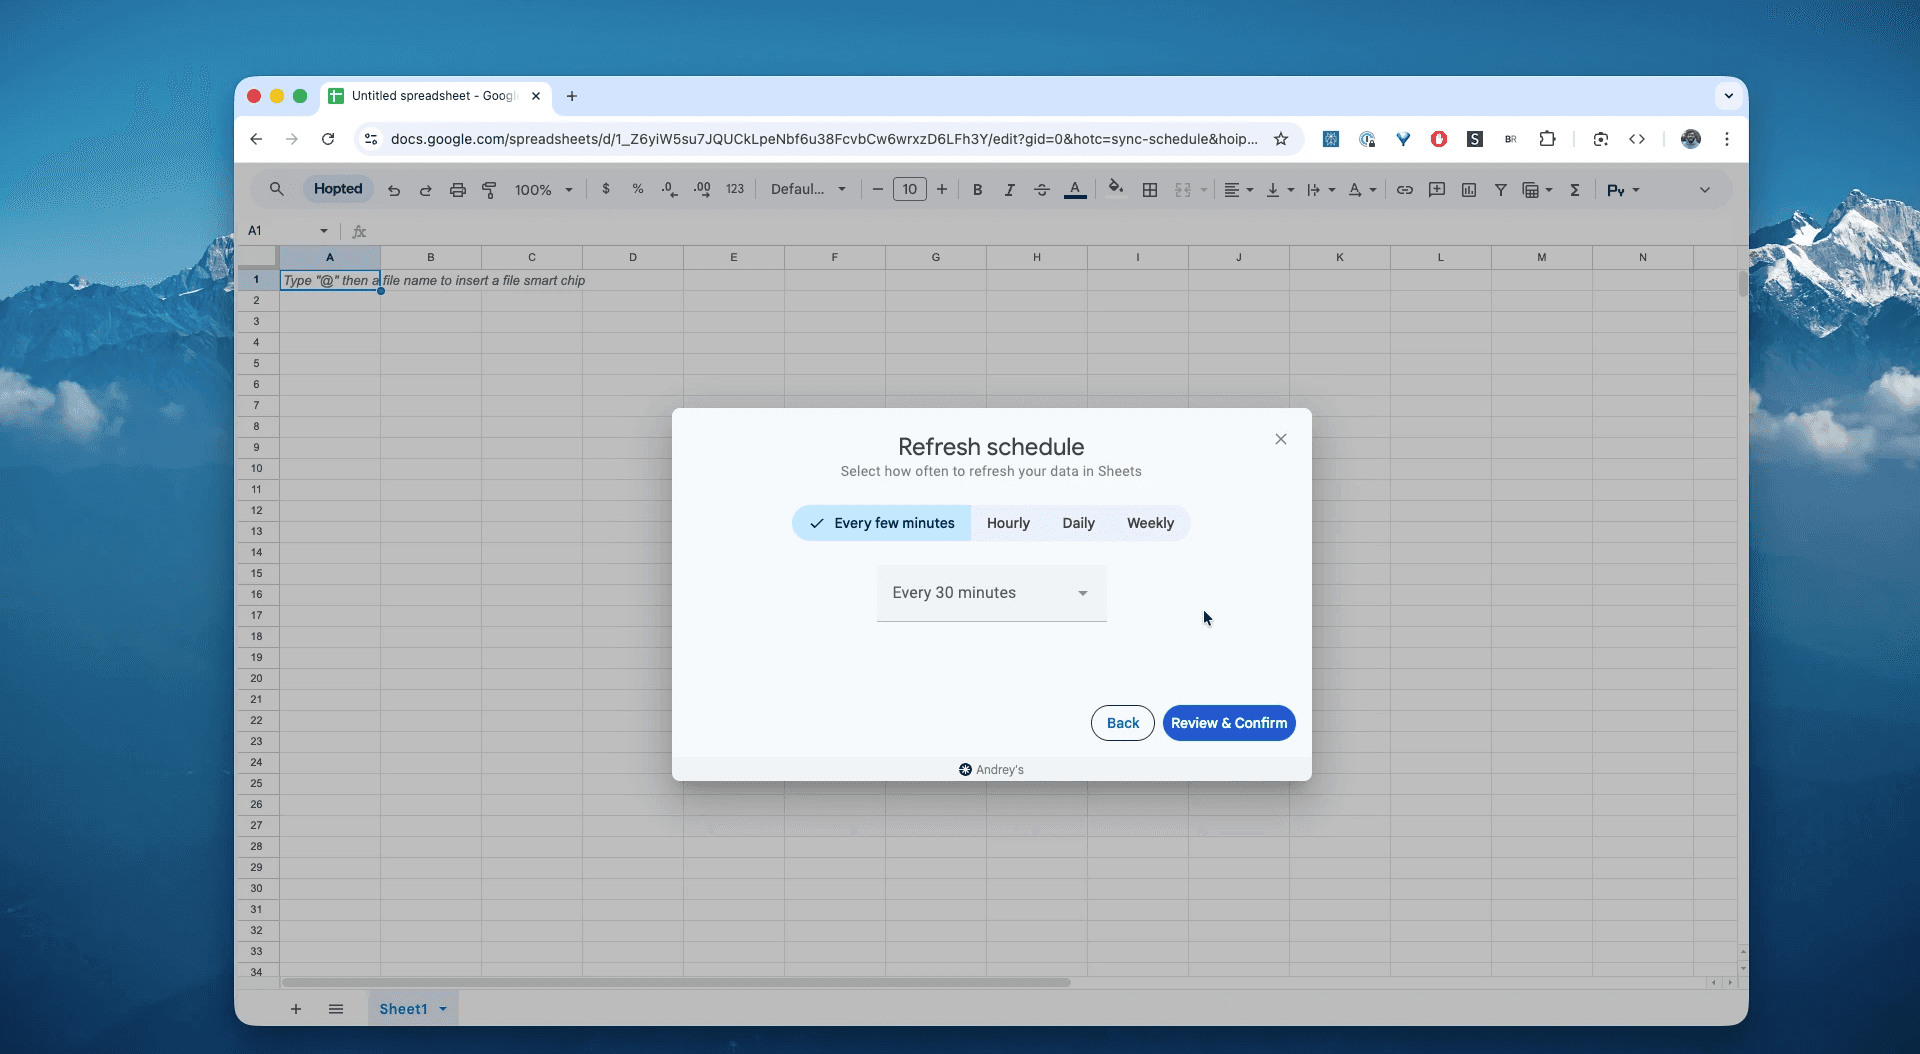
Step 5.
Set your schedule. Choose how often you want to export and refresh your Amazon sales and traffic—every hour, every day, or less frequent.
Step 6.
Save your data pipeline. This will export your Amazon sales and traffic data from Seller Central into spreadsheets instead of dealing with CSVs. The business report in your spreadsheets will be up to data forever.
What is the Amazon Sales & Traffic (by SKU) Report?
This is one of the most powerful Business Reports in Seller Central. It provides a SKU-level breakdown of your key sales and traffic funnels. It's the ultimate diagnostic tool for your product listings. The scope vs. sibling reports: “By Child Item (SKU)” mirrors “By Child ASIN/By ASIN” but keys on your MSKU, which is what ops/ads often optimize against.
This makes it the single source of truth for answering questions like:
Which products get a lot of traffic (Sessions) but no sales (Units Ordered)?Which products have a high conversion rate (Unit Session Percentage)?Is my Buy Box percentage dropping on my key items?Where are we losing Buy Box and how much revenue is at stake?Which products need listing improvements vs pricing/repricing vs ad support?Are sessions trending up but units flat (fit issue), or is traffic the bottleneck?How do B2B sessions/sales compare to retail for top SKUs?
How to Analyze & Track Your Amazon Sales and Traffic in Spreadsheets
Now that you have a live feed, you can move from data entry to data analysis. This is the real power of analyzing your Amazon Seller Central data in spreadsheets and building your Amazon excel-like template.
Here are 4 Amazon spreadsheet template ideas you can build immediately:
Template 1: The "Traffic & Buy Box" Health Monitor
This dashboard helps you track your Amazon data for sudden changes.
How to build it: Another Pivot Table.
Rows:
SKU.Values:
SUM of Sessions(for this week) andSUM of Sessions(for last week).Values 2:
Average of Buy Box Percentage.Alerts: For monitoring purposes set conditional notifications to track changes in your Buy Box on the item level.
What it shows you: You can instantly see if traffic to a key SKU has collapsed (check your ad campaigns or keyword indexing) or if your Buy Box percentage has dropped, indicating a new competitor.
Template 2: The "Conversion Rate (Unit Session %)" Trend Chart
This is your most important marketing chart.
How to build it: Create a Pivot Table.
Rows:
Date(right-click and "Group by Week" or "Month").Columns:
SKU(or(Parent) ASIN).Values:
Average of Unit Session Percentage.What it shows you: A simple line chart plotting this pivot table will show you exactly which products are improving and which are declining. This is how you prove your listing optimizations are working.
Template 3: Period-over-Period Watch
Compare sales to your historic past performance: last 30d vs last year's same range
How to build: Week-over-week deltas for Sessions, Buy Box %, Unit Session % for different date ranges
Shows: Catch effects of price changes, image swaps, A+ updates, or competitor entry.
Template 4: The "High Traffic, Low Conversion" Red Flag Report
This is your immediate optimization to-do list.
How to build it: Use a simple "Filter" view on your raw data tab.
Filters: Set
Date= "Last 30 Days,"Sessions> 1000 (or your baseline), andUnit Session Percentage< 5% (or your baseline).What it shows you: This instantly surfaces the products that are "leaking" money. You are getting the traffic (maybe from ads), but they aren't converting. These are the listings to fix today.
Common workflows this report unlocks
Pinpoint conversion leaks: Separate traffic problems (low sessions) from offer/price problems (low Buy Box %) and page/fit problems (low Unit Session %).
Prioritize fixes by impact: Rank SKUs by lost sales due to Buy Box loss or sub-par conversion.
Guide ads & inventory: Feed winners to ads; slow movers to listing/price tests; protect stock for SKUs with high conversion.
FAQ about Amazon Sales And Traffic (by SKU) Report
Q: What’s the difference between Unit Session % and conversion rate?
Amazon’s Unit Session % = units ÷ sessions; “conversion rate” in other tools may use orders ÷ sessions—don’t mix them.
Q: How is Buy Box % calculated in Business Reports?
No one knows the Buy Box algorithm. If someone explains you the way how featured offer for a product works — run from that person. They don't know what do they say.
Q: Can I export Sales & Traffic by SKU to Excel/Google Sheets?
Yes—export from Business Reports and analyze in Sheets; we recommend daily/weekly snapshots for period comparisons. You can export and have columns for different reporting ranges in a same tab in a spreadsheet. For instance, a column for 7d sales, 14d sales, 30d sales and 60d sales by SKU. All containing live data directly from your Seller Central account. See our guide above.
Q: What is the difference between Sessions and Page Views in Amazon Business Reports?Sessions are the number of unique customer visits to your product pages (similar to a unique user). Page Views are the total number of times your pages were viewed. If one customer views your page 3 times, that is 1 Session and 3 Page Views. Sessions is the correct metric to use for calculating conversion rate.
Q: What is a good Unit Session Percentage (conversion rate) on Amazon?
This varies widely by category, price, and traffic source. However, a general benchmark is often cited as 5%-15%. The most important thing is not the absolute number but its trend. You should be focused on tracking your Unit Session Percentage over time to see if your marketing efforts are improving it.
Q: What is the Amazon Buy Box / Featured Offer?
The Buy Box—now called the Featured Offer—is the offer shown next to the Add to Cart / Buy Now buttons on a product detail page; it’s the offer most shoppers purchase when multiple sellers list the same item.
Q: Is "Featured Offer" the same as the Buy Box?
Yes. Amazon’s current term is Featured Offer (formerly the Buy Box); it determines which seller’s offer is shown by default on the detail page.
Q: Why does the Buy Box matter so much?
Industry analyses estimate ~80%+ of sales flow through the Featured Offer (even higher on mobile), so owning it can dramatically lift units and revenue.
Q: Who is eligible to win the Buy Box?
Generally, sellers need a Professional selling plan, offers in New condition, and a competitive price. Eligibility also depends on account health/performance. Exact inputs vary by category.
Q: Which performance metrics influence Buy Box eligibility and rotation?
Amazon weighs Order Defect Rate (keep <1%), Late Shipment Rate (keep <4%), and Valid Tracking Rate (≥95%), among others. Poor scores can reduce eligibility or visibility.
Q: Does FBA (Fulfilled by Amazon) help win the Buy Box?
While Amazon doesn’t publish the exact algorithm, fulfillment speed/reliability (often stronger with FBA/Prime) can improve competitiveness alongside price and account health. (See “Becoming the Featured Offer.”)
Q: Can multiple sellers “share” the Buy Box?
Yes. Amazon rotates the Featured Offer among eligible sellers; rotation depends on delivered price, shipping speed, availability, and performance metrics.
Q: Why is the Buy Box missing or “suppressed” on my listing?
Amazon can suppress the Featured Offer—commonly for uncompetitive pricing (per the Marketplace Fair Pricing Policy) or weak offer quality/metrics. When suppressed, no seller is featured.
Q: What is Amazon’s Fair Pricing Policy and how does it relate to the Buy Box?
If Amazon detects pricing that could harm customer trust (e.g., meaningfully higher than elsewhere), it may remove the Featured Offer, remove the offer, or limit shipping options until pricing is corrected.
Q: Do I need the lowest price to win the Buy Box?
Not always. Amazon evaluates landed price plus seller performance, shipping speed, stock availability, and customer experience. A slightly higher price can still win if the overall offer is better.
Q: How do I increase my chances of winning the Buy Box?
Maintain ODR <1%, LSR <4%, VTR ≥95%; keep stock available; use fast shipping (Prime/FBA if possible); and price competitively relative to the market.
Q: Can Amazon itself hold the Buy Box—and can I still win?
Yes, Amazon Retail can hold it. Third-party sellers can still win/rotate when their landed price and offer qualityoutperform at times. (Rotation is dynamic and time-weighted.)
Q: Why did my Buy Box disappear after a price change?
Large price jumps versus historical or off-Amazon prices can trigger suppression under fair-pricing rules; revert to competitive pricing and recheck eligibility.
Q: How fast do Buy Box changes take effect?
Rotation and eligibility can update throughout the day; Business Reports may restate historical data due to returns/adjustments—monitor trends, not single pulls.
Q: How is Hopted different from other Amazon seller software?
Most Amazon tools force you into their rigid dashboards and pre-built reports. You have to change your workflow to fit their software. With Hopted is the opposite. It’s a flexible data automation layer that works directly inside your existing spreadsheets (like Google Sheets). Instead of forcing you to learn a new system, Hopted brings all your scattered Amazon data (sales, inventory, orders, etc.) right to you. You can build the fully custom reports and automations you need, not the ones a rigid tool dictates.


Hopted,
explained.
Watch the film