Are you acquiring one-time buyers, or are you building a sustainable brand? The Amazon Repeat Purchase Behavior Report holds the answer. It's the key to understanding if your marketing is creating loyal customers or just generating one-off sales. This guide shows you how to stop managing files and start analyzing your marketing. We'll cover how to automatically pull your Repeat Purchase Behavior report directly into Google Sheets to build a live customer retention dashboard.

How to Automatically Sync & Import the Repeat Purchase Behavior Report to Google Sheets (The Hopted Way)
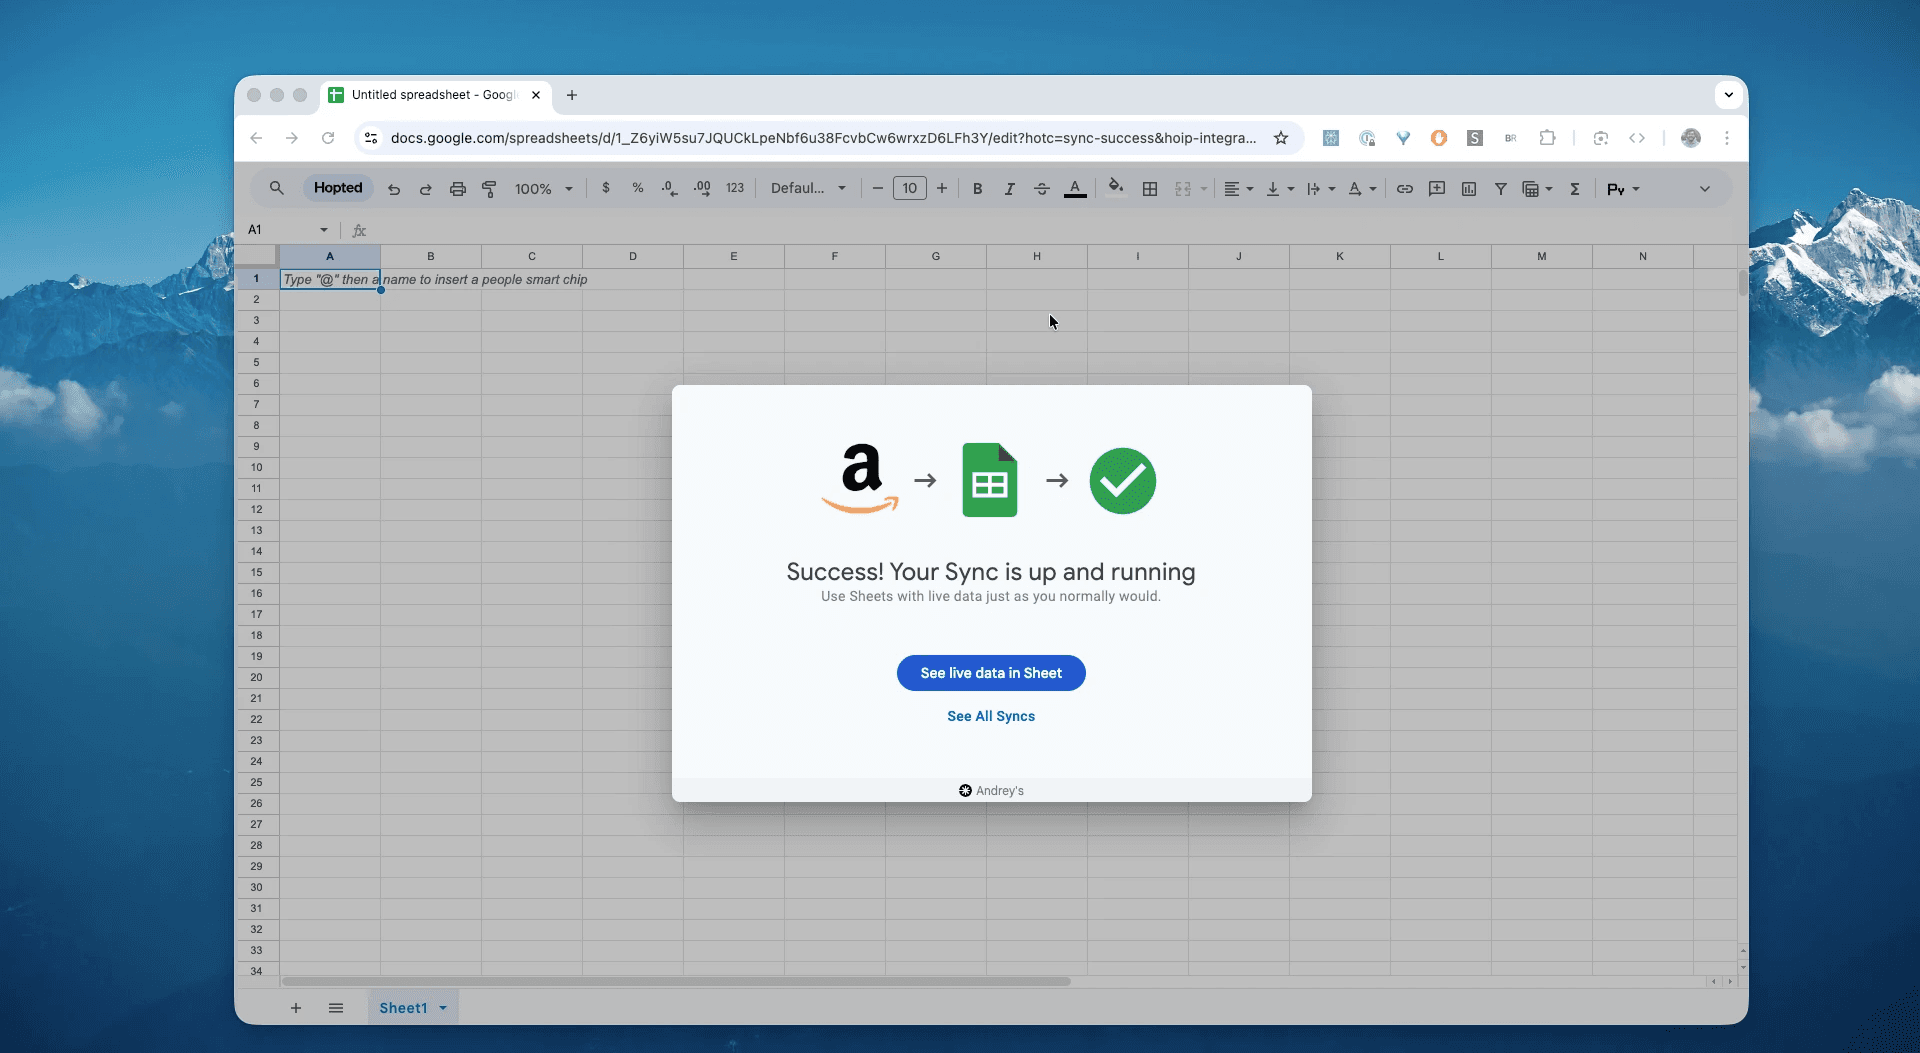
Using an Amazon to Google Sheets integration like Hopted, you set up the connection once, and your data flows automatically.
Step 1.
Install the Hopted browser extension and sign in using your Google Account.
Step 2.
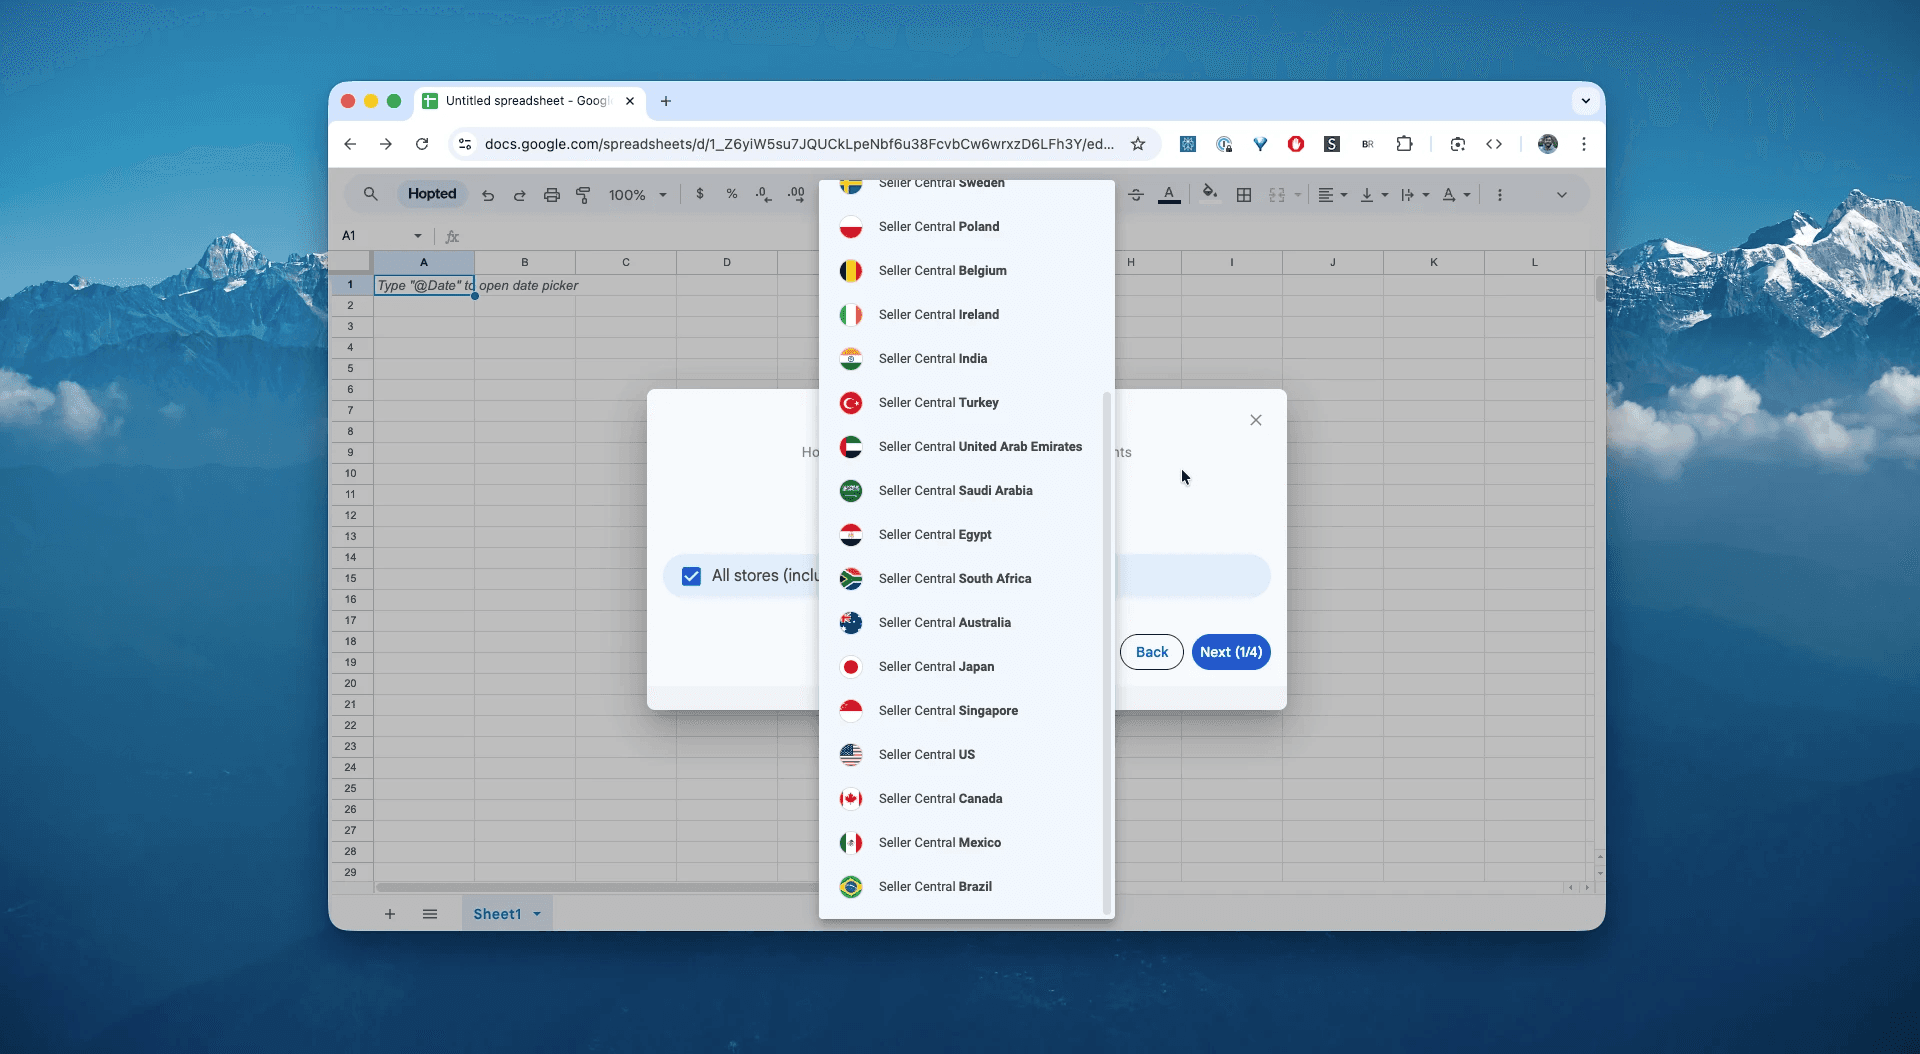
Securely connect your Amazon Seller Central to Google Sheets using Hopted's integration wizard.
Step 3.
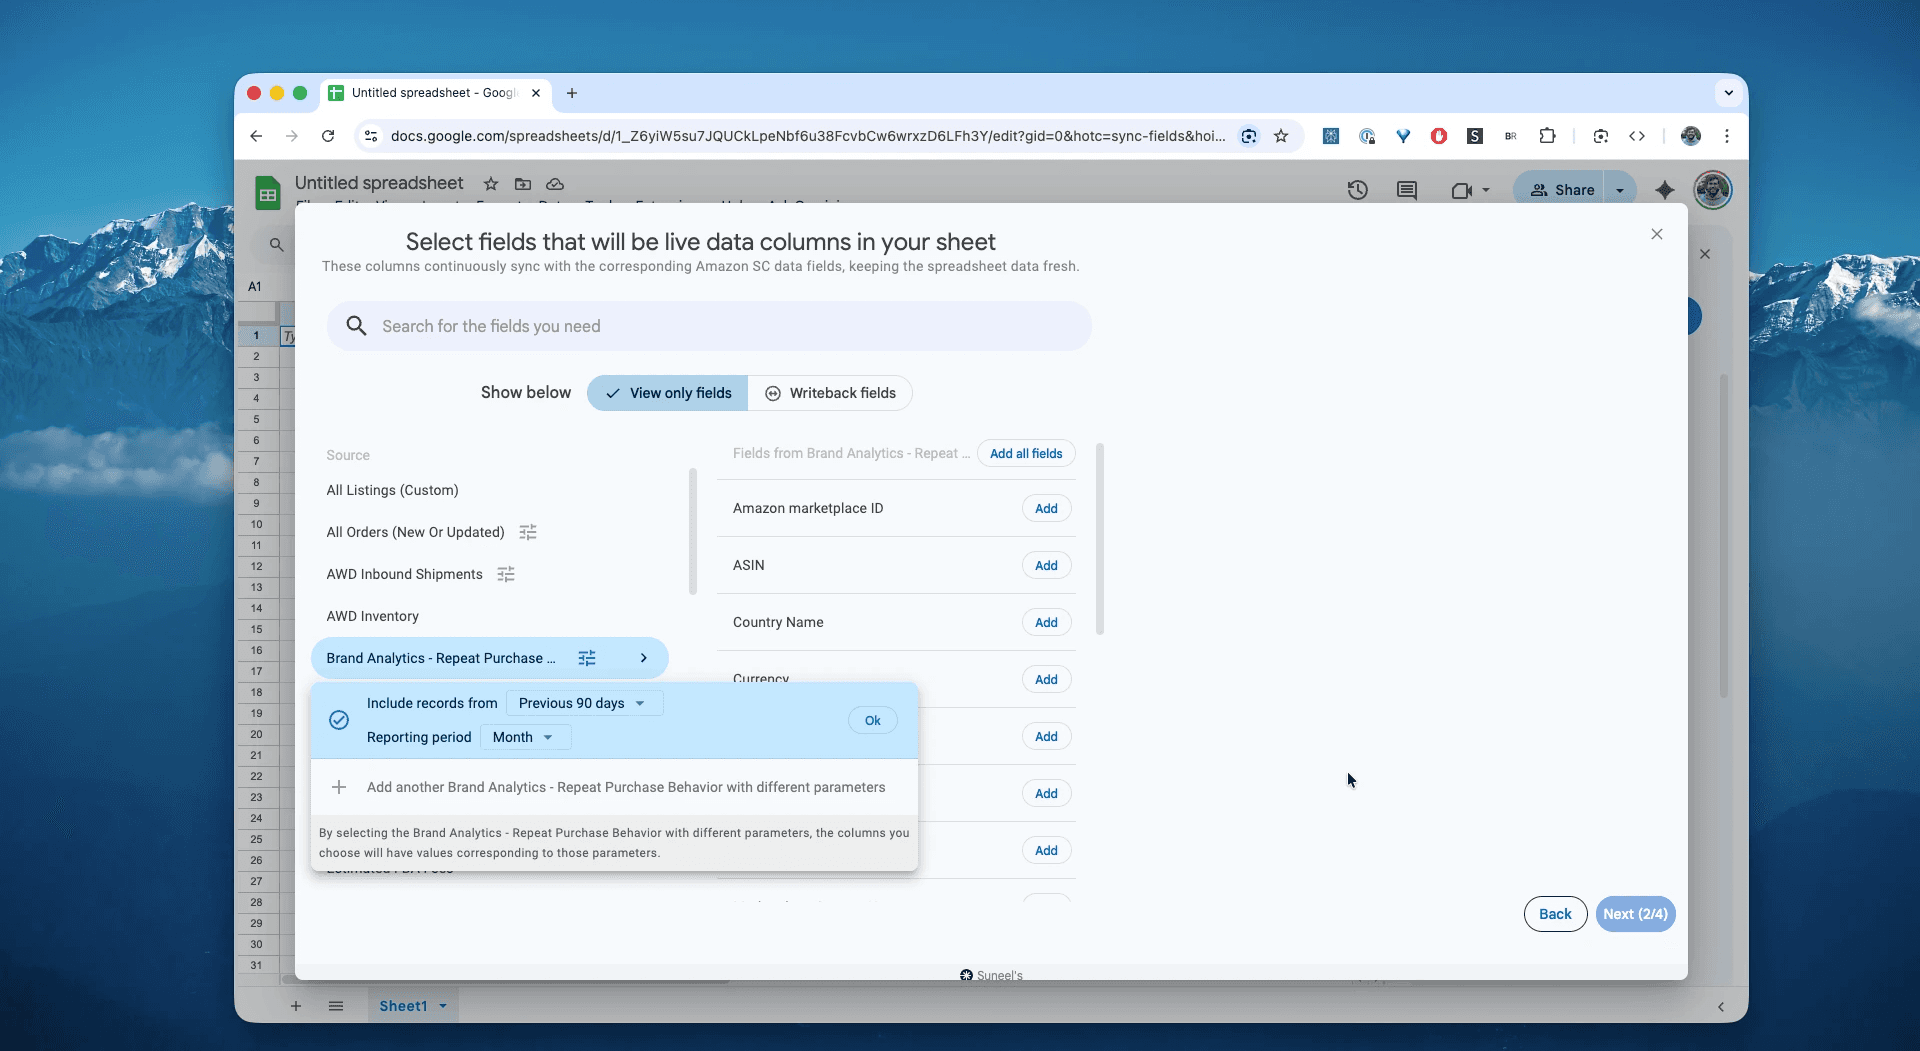
In Google Sheets, from the list of available Amazon Seller Central reports, select "Repeat Purchase Behavior" for a specific date range. This can be as recent as the "Today" or a custom range going as far back as 23 months. For this example, we'll select "Include records for the last 90 days".
Step 4.
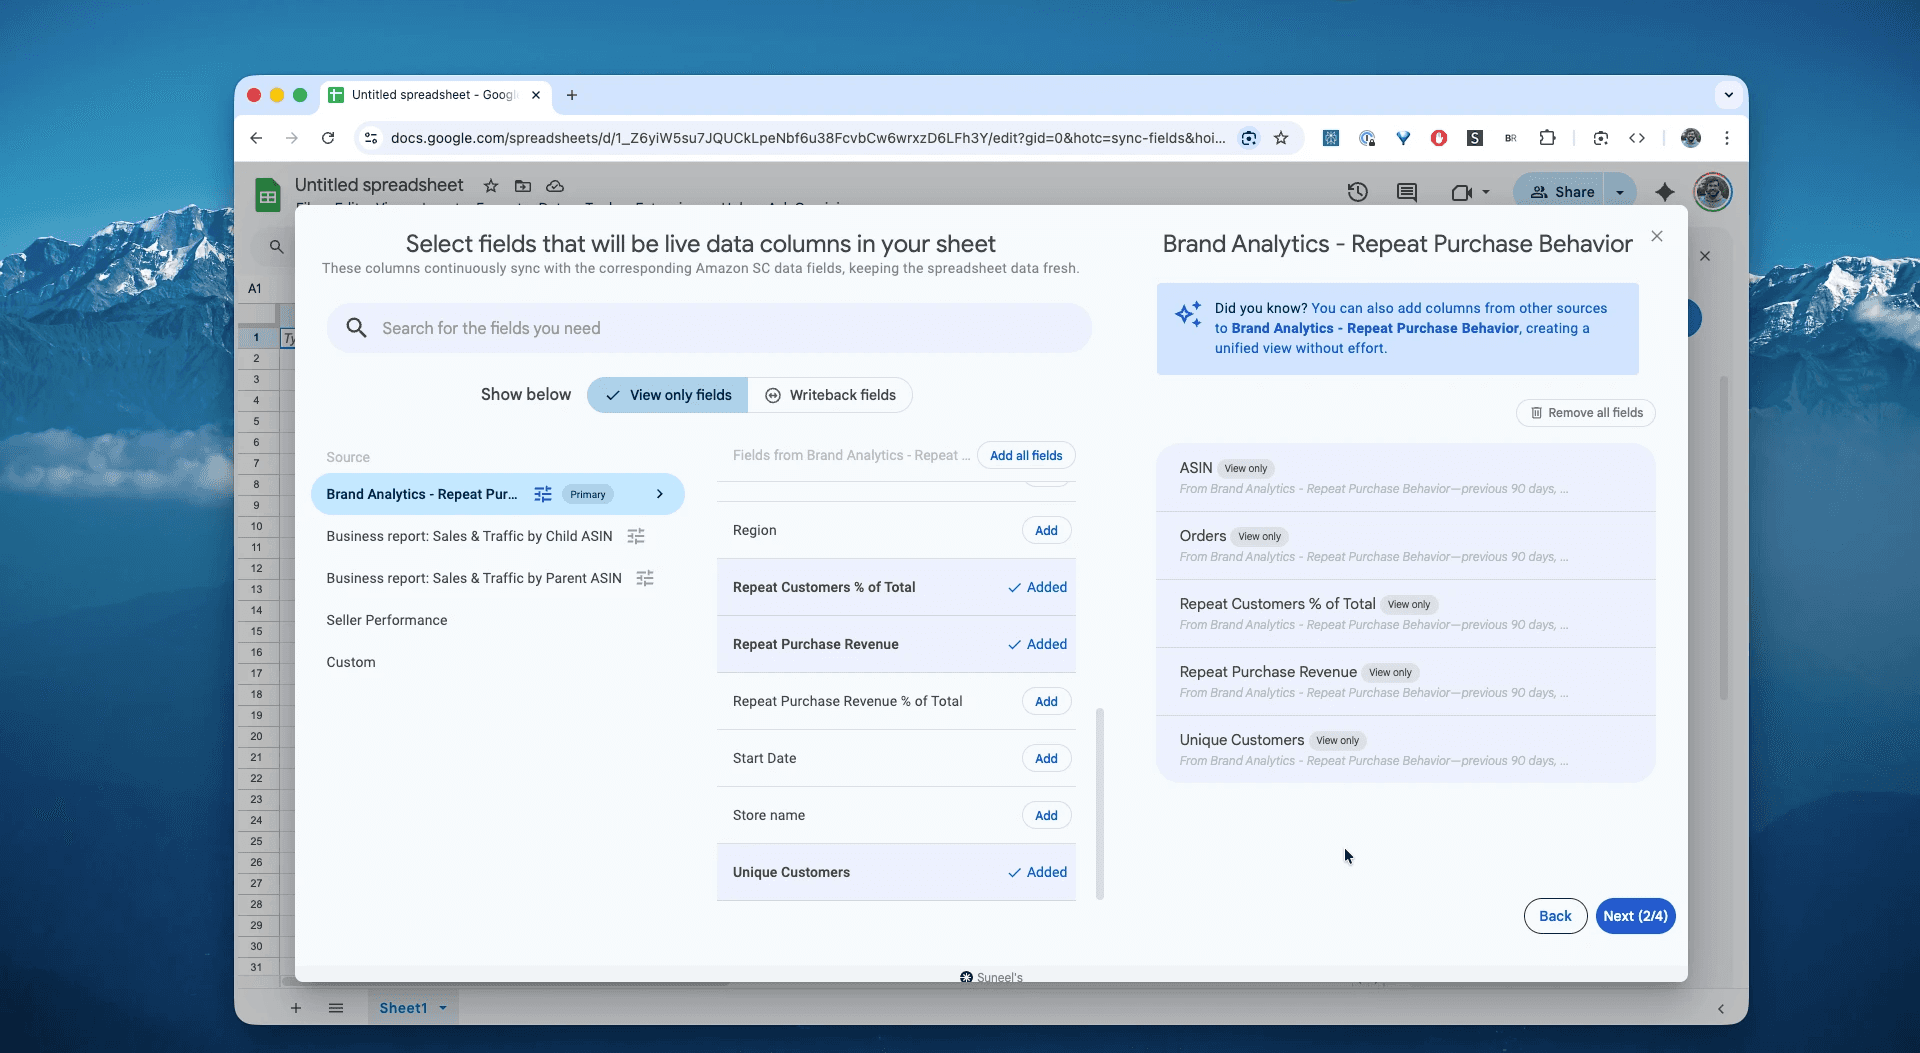
Select columns that you need: ASIN, Orders, Repeat Customers % of Total, Repeat Purchase Revenue, Unique Customers and other fields.
Step 5.
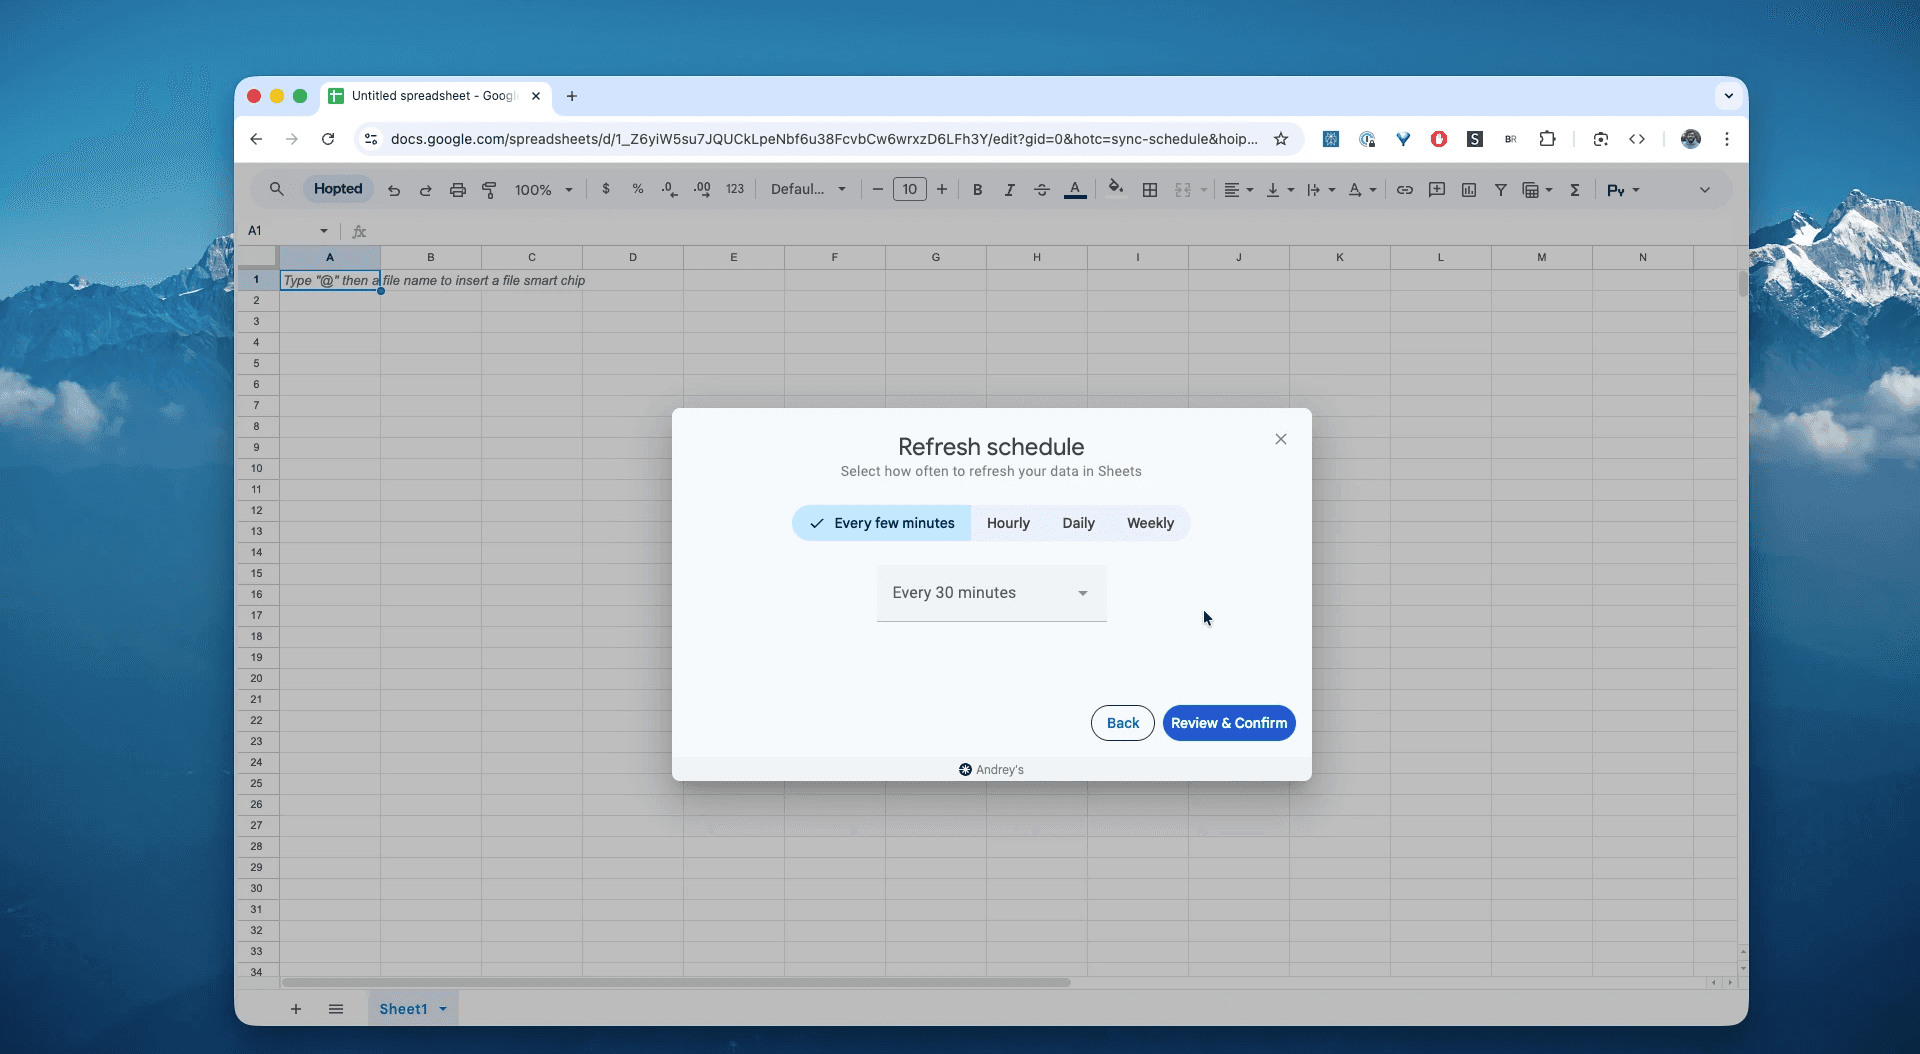
Set your schedule. Choose how often you want to export and refresh your repeat buyers brand analytics—every hour, every day, or less frequent.
Step 6.
Save your data pipeline. This will export your Amazon repeat purchases from Seller Central into spreadsheets instead of dealing with CSVs. The analytics in your spreadsheets will be up to data forever.
What is the Amazon Repeat Purchase Behavior Report?
Available to brands in Amazon Brand Analytics with Brand view and ASIN view. Lets you track orders received, sales from repeat purchases, and the number of repeat customers over time.
This report provides key metrics, including:
Unique Customers: The total number of unique buyers.
Repeat Customers: The number of customers who placed more than one order.
Repeat Purchase Sales: The total sales ($) generated from repeat customers.
Repeat Purchase Units: The total units sold from repeat customers.
This data is the ultimate way to assess the effectiveness of your marketing campaigns, email lists, and customer retention efforts.
This makes it the single source of truth for answering questions like:
What’s our repeat order share and repeat customer trend by brand vs. ASIN?Which ASINs generate the most repeat revenue and repeat orders this month?Which products are best candidates for Subscribe & Save or brand-tailored promos?Are retention metrics improving after changes to ads, pricing, or packaging?How should we allocate inventory & ad spend toward high-repeat SKUs?
How to Analyze & Track Your Amazon Repeat Buyers in Spreadsheets
Now that you have a live feed, you can move from data entry to data analysis. This is the real power of analyzing your Amazon Seller Central data in spreadsheets and building your Amazon excel-like template.
Here are 3 Amazon spreadsheet template ideas you can build immediately:
Template 1: The "Monthly Retention" Trend Chart
This is your most important chart for tracking your Amazon data.
How to build it: Use a Pivot Table.
Rows:
Date(right-click and "Group by Year-Month").Values:
SUM of Repeat CustomersandSUM of Unique Customers.Formula: In a new column, add a formula:
='Repeat Customers' / 'Unique Customers'(and format as %).What it shows you: A simple line chart of this percentage shows if your brand loyalty is actually improving over time.
Template 2: The "Sticky Product" Finder
Find out which products create loyal customers.
How to build it: Another Pivot Table.
Rows:
ASIN.Values:
SUM of Repeat Purchase Sales.Sort: Sort by "Repeat Purchase Sales" from high to low.
What it shows you: This instantly reveals your most valuable products. These are the ASINs you should never stock out of and should feature in your retention marketing.
Template 3: The "Simple CLV" Calculator
This is the first step in building an Amazon seller data automation tool for marketing.
How: Create a Pivot Table.
Rows:
Ship stateorShip countryValues:
SUMofQuantity purchasedandSUMofItem priceResult: A simple report showing your top-performing regions, helping you make decisions about inventory and ad spend.
Common workflows this report unlocks
Spot subscription/cross-sell candidates and build tailored promos toward known re-buyers.
Quantify retention & LTV: identify SKUs and categories that drive repeat revenue.
Guide ad strategy (SD/remarketing) and forecast re-order demand to avoid stockouts.
FAQ about Amazon Repeat Purchase Behavior
Q: What is the best way to track Amazon customer retention?
The best way is to automate your Repeat Purchase Behavior report. By scheduling a tool like Hopted to pull this report into the same Google Sheet every month, you create a historical database. You can then build a simple line chart to track your repeat purchase rate over time, which is the key metric for customer retention.
Q: How do I calculate Customer Lifetime Value (CLV) for my Amazon brand?
A true CLV calculation is complex, but the first and most important step is to automate your data. Use an Amazon to Google Sheets integration to pull your Repeat Purchase Sales data from the Repeat Purchase Behavior report. You can then compare this long-term sales data to your customer acquisition costs to build a working CLV model in your spreadsheet.
Q: How can I analyze which of my products get the most repeat buyers?
Pull your Repeat Purchase Behavior report into Google Sheets. The report contains data by ASIN. You can create a simple Pivot Table with "ASIN" as the row and "SUM of Repeat Purchase Sales" as the value. Sorting this list will instantly show you which products are driving the most loyalty and repeat business.
Q: How is this different from Market Basket Analysis or Search analytics?
Repeat Purchase Behavior focuses on retention/rebuys, while Market Basket shows co-purchases and Search dashboards show discoverability & funnel metrics.
Q: How do I improve repeat rate after diagnosing weak ASINs?
Test Brand Tailored Promotions, loyalty bundles, or S&S; fix CX (detail page, pricing, pack size), and remarket via Sponsored Display.
Q: How is Hopted different from other Amazon seller software?
Most Amazon tools force you into their rigid dashboards and pre-built reports. You have to change your workflow to fit their software. With Hopted is the opposite. It’s a flexible data automation layer that works directly inside your existing spreadsheets (like Google Sheets). Instead of forcing you to learn a new system, Hopted brings all your scattered Amazon data (sales, inventory, orders, etc.) right to you. You can build the fully custom reports and automations you need, not the ones a rigid tool dictates.


Hopted,
explained.
Watch the film