Pull structured performance for Best Deals and Lightning Deals including glance views, units sold, revenue and ASIN-level breakdowns. This guide shows you how to stop downloading and start automating. We'll cover how to export your promotions performance to Google Sheets, enabling you to auto-import and sync your promotions data on a schedule. No more copy-pasting.

How to Automatically Sync & Import the Promotions Performance Report to Google Sheets (The Hopted Way)
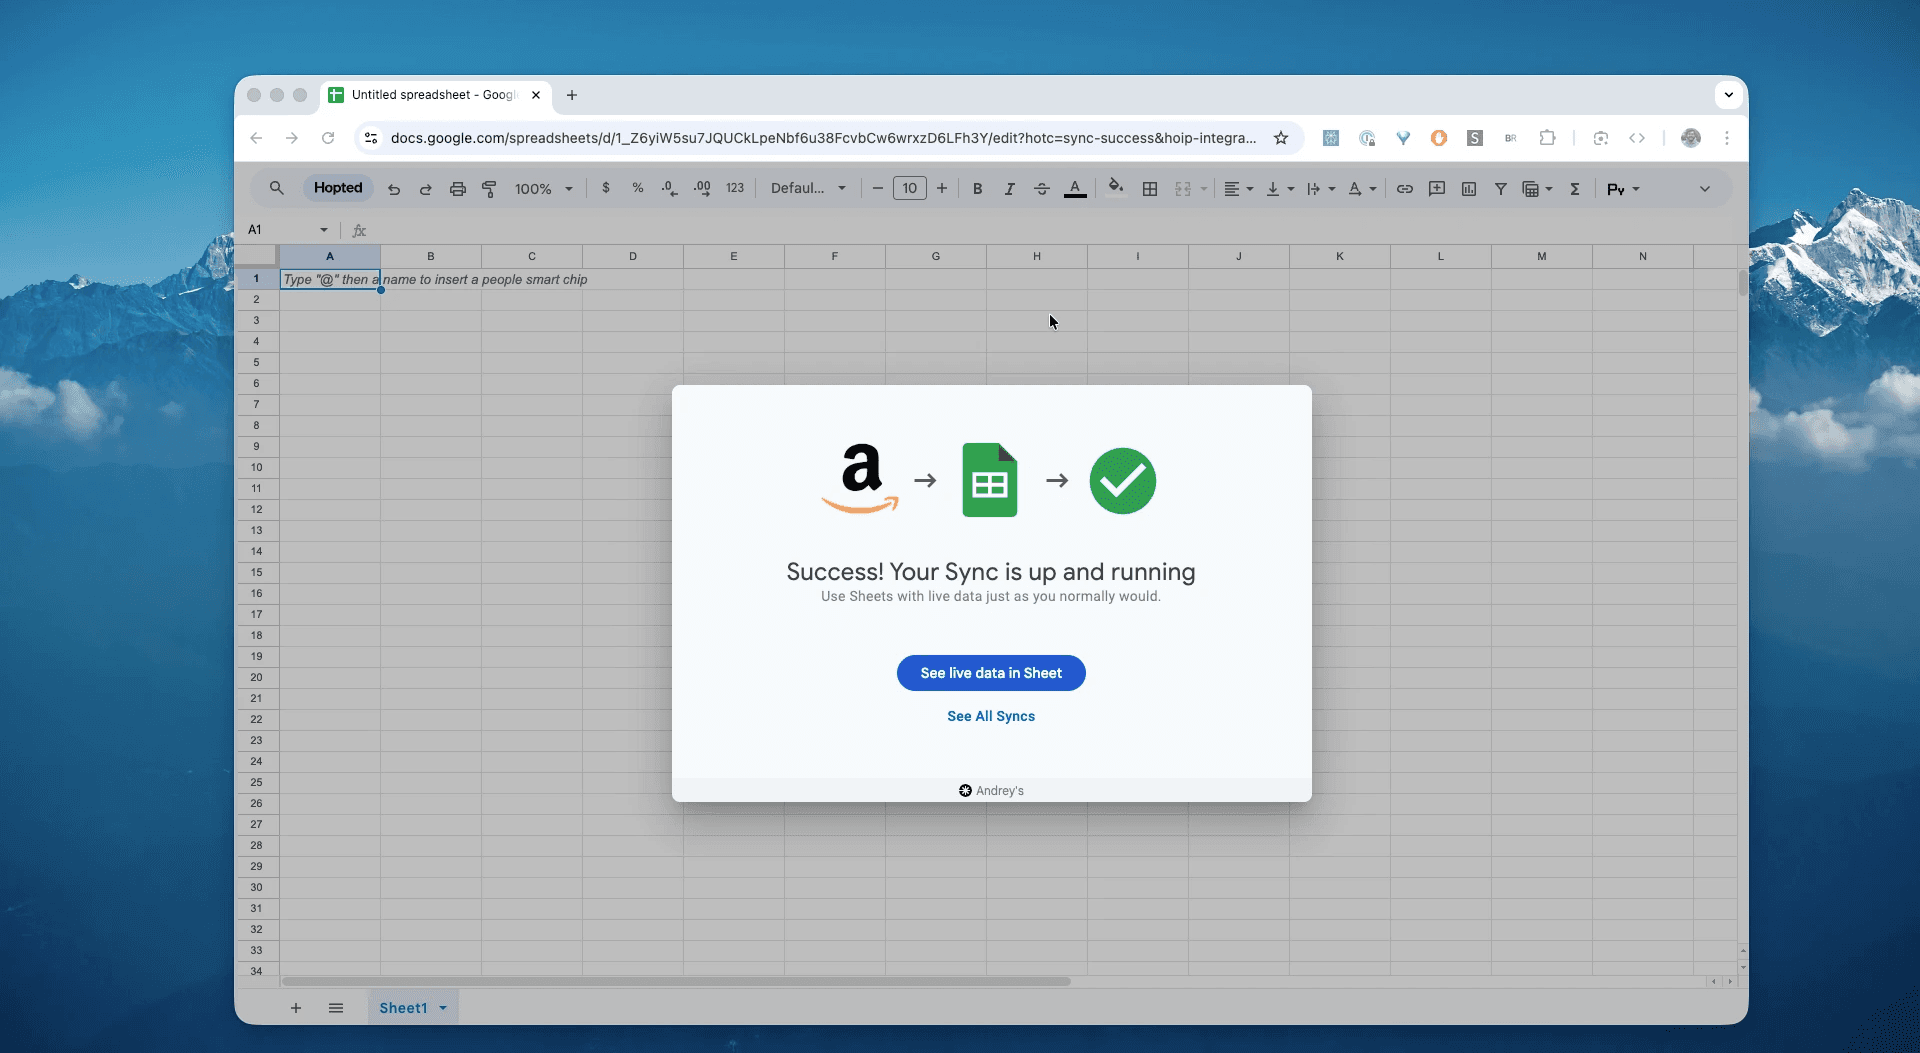
Using an Amazon to Google Sheets integration like Hopted, you set up the connection once, and your data flows automatically.
Step 1.
Install the Hopted browser extension and sign in using your Google Account.
Step 2.
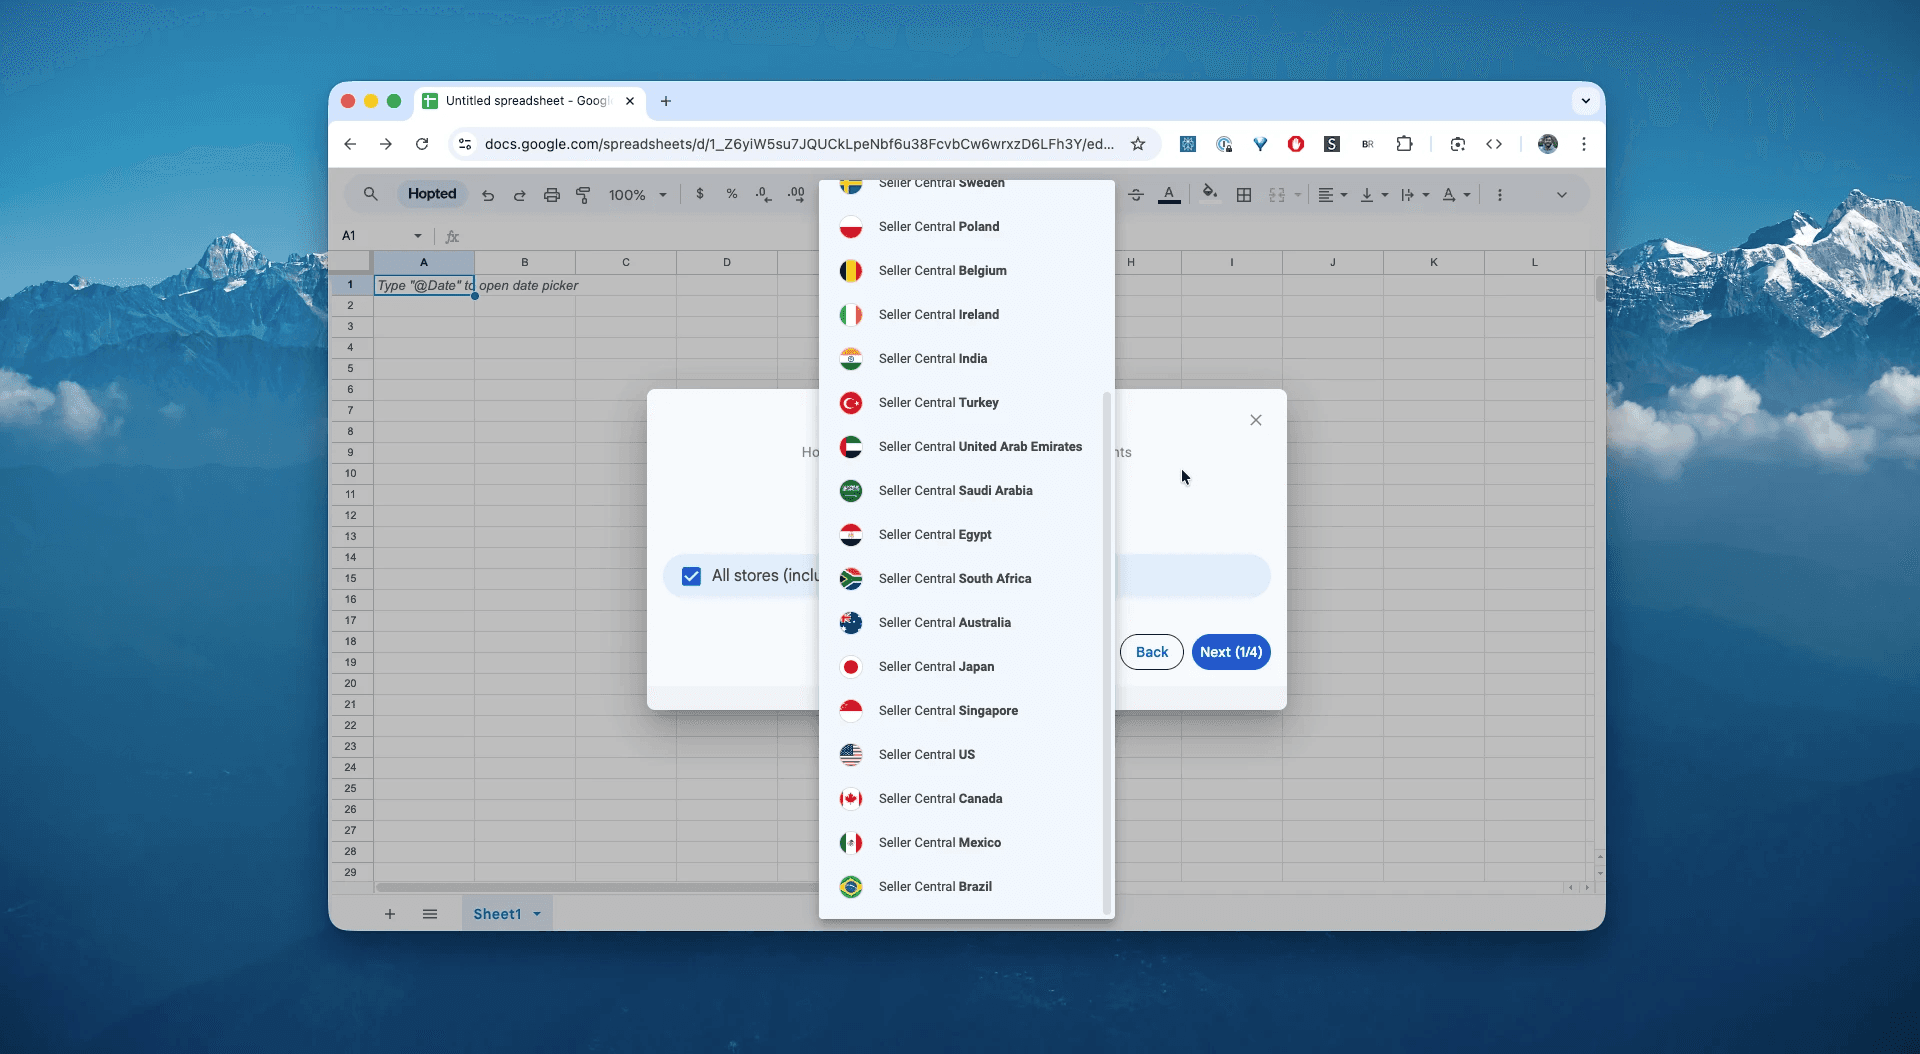
Securely connect your Amazon Seller Central to Google Sheets using Hopted's integration wizard.
Step 3.
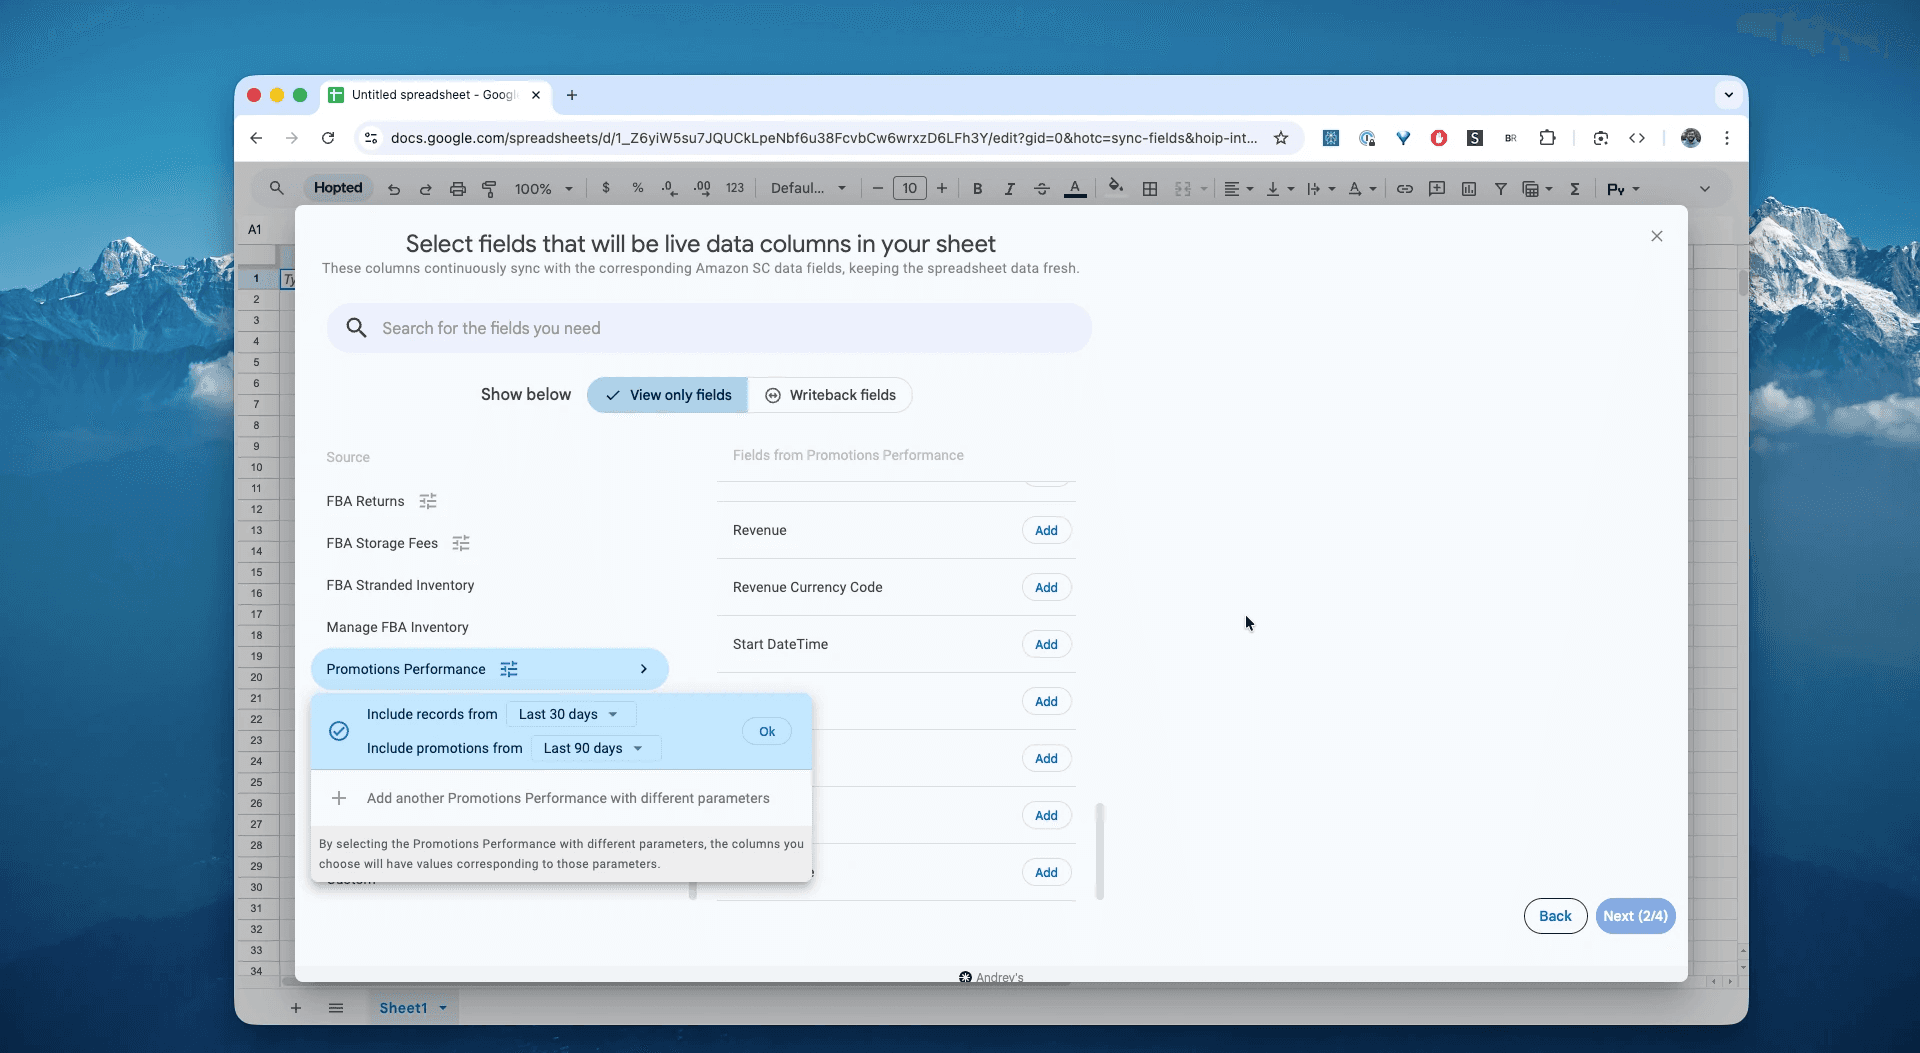
In Google Sheets, from the list of available Amazon Seller Central reports, select "Promotions Performance" for a specific date range. This can be as recent as the "Last 24 hours" or a custom range going as far back as 23 months. For this example, we'll select "Include records for the last 30 days".
Step 4.
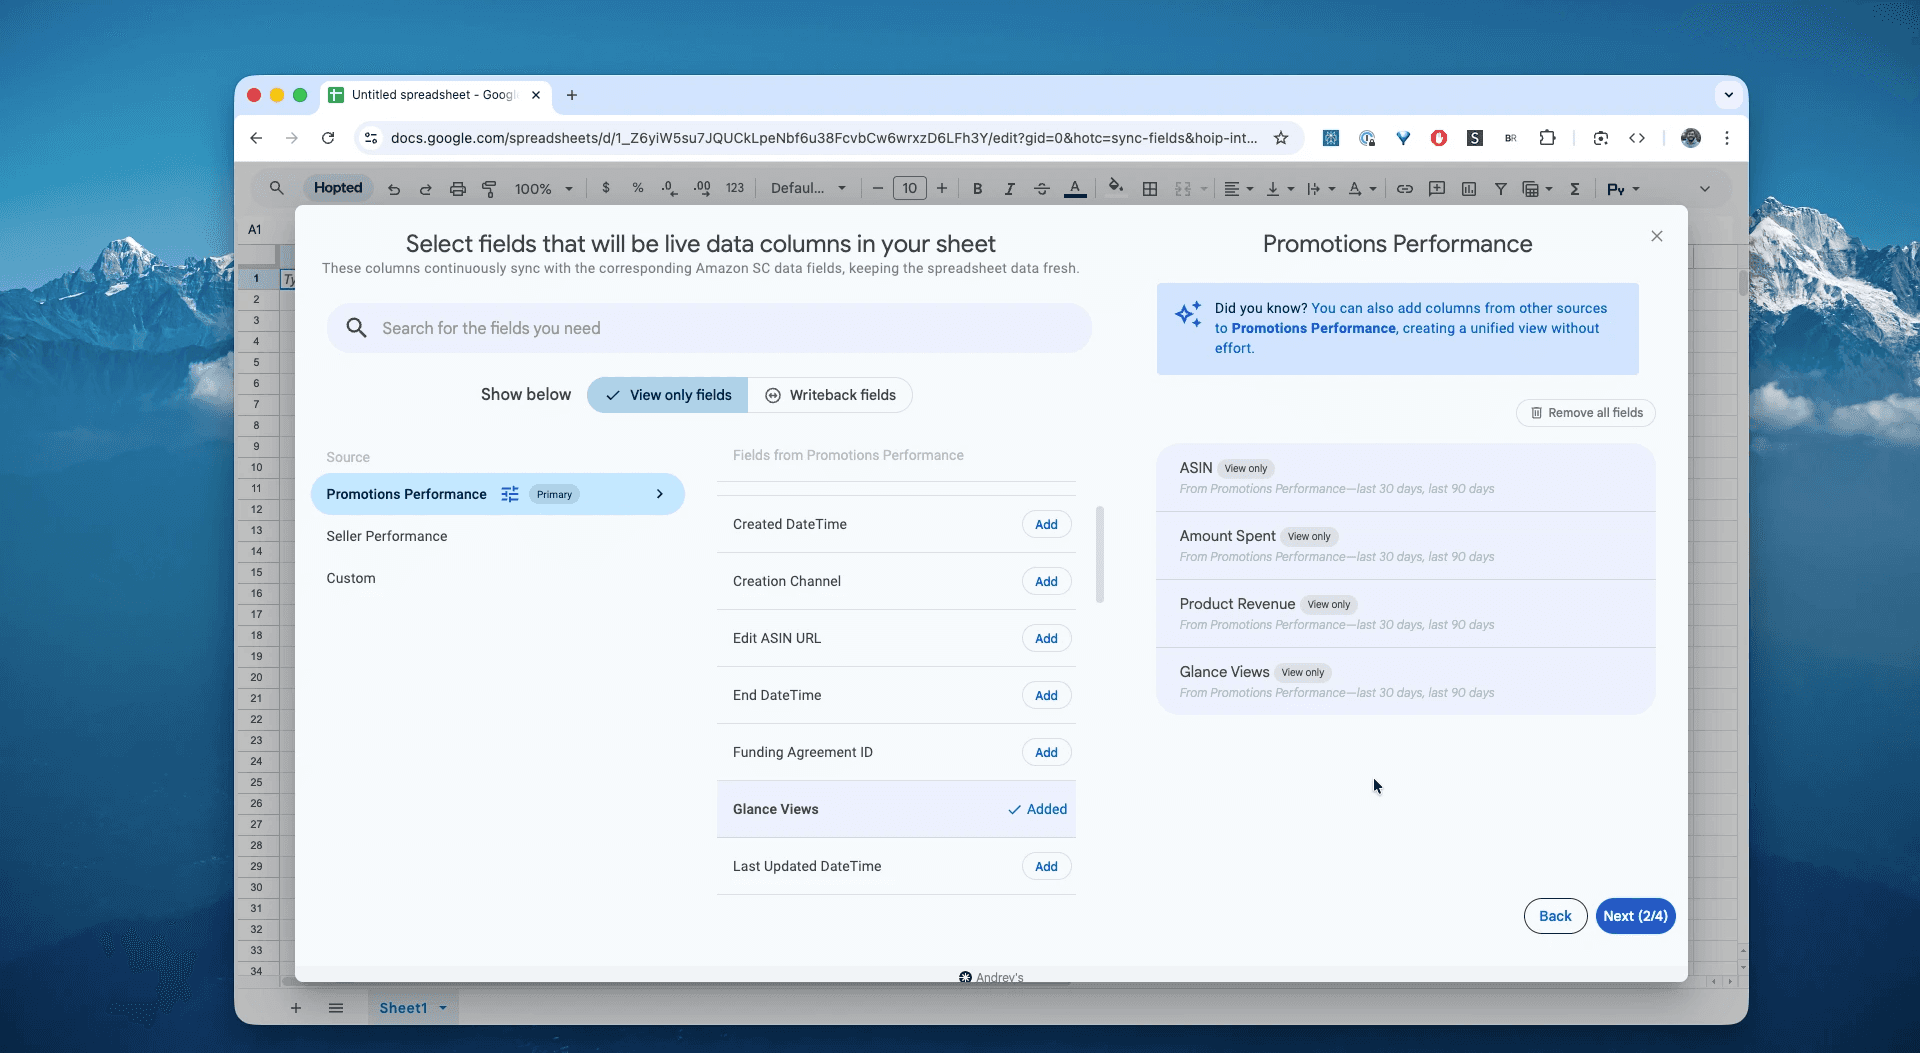
Select columns that you need: ASIN, amount spent, product revenue, glance views, and other fields.
Step 5.
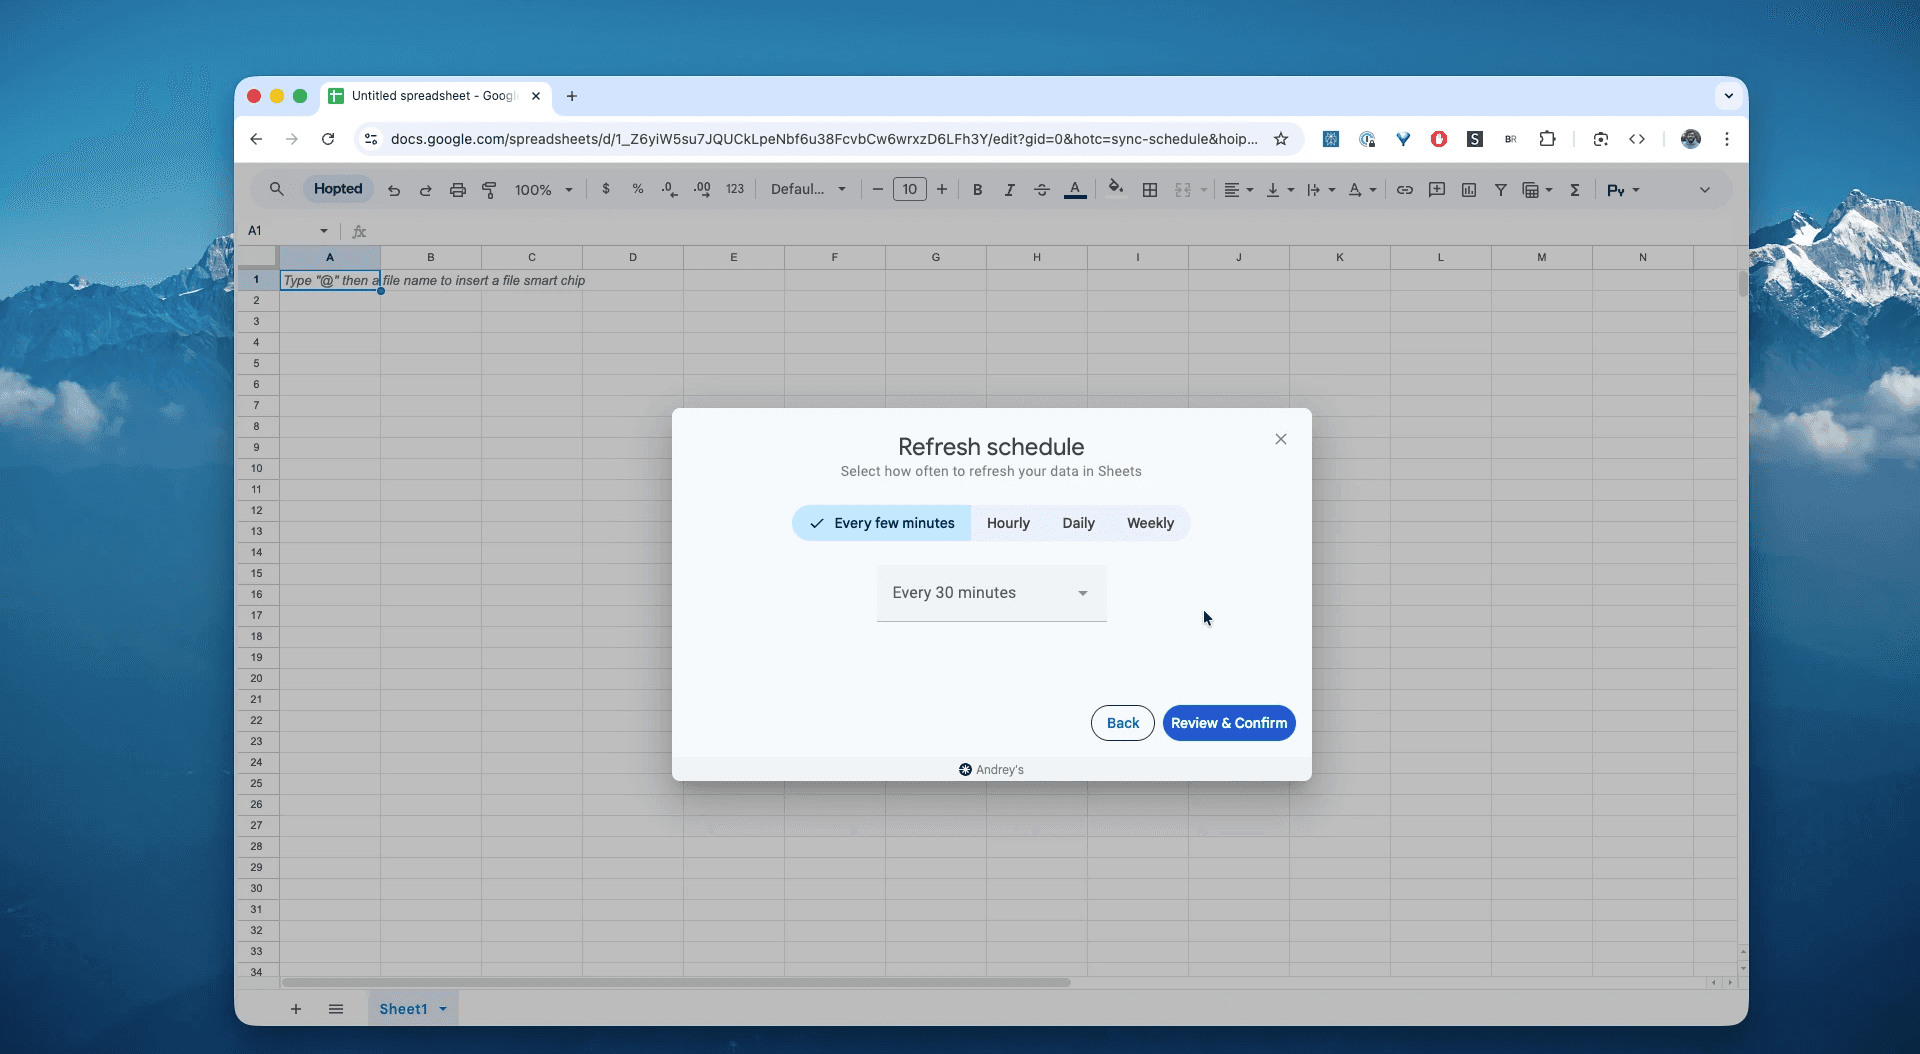
Set your schedule. Choose how often you want to export and refresh your Amazon promotions performance data—every hour, every day, or less frequent.
Step 6.
Save your data pipeline. This will export your Amazon promotions from Seller Central into spreadsheets instead of dealing with CSVs. The orders in your spreadsheets will be up to data forever.
What is the Amazon Promotions Performance Report?
This is the official, high-level report that summarizes the performance of your seller-funded promotions, such as "Percentage Off," "Buy One Get One," or "Lightning Deals."
Its sole purpose is to help you analyze your promotion ROI. It's the only report that directly answers:
How many units were sold using this specific promotion?What was the total revenue generated by those units?How much did the promotion cost in revenue (discounts)?Which promotion type (Best Deal, Lightning Deal) was used?
How to Analyze & Track Your Promotions Performance in Spreadsheets
Now that you have a live feed, you can move from data entry to data analysis. This is the real power of analyzing your Amazon Seller Central data in spreadsheets and building your Amazon excel-like template.
Here are 3 Amazon spreadsheet template ideas you can build immediately:
Template 1: The "Master Promotions" Leaderboard
This report answers: "Which of my promotions actually worked?"
Create a Pivot Table from your Hopted data sheet.
Rows: Add
promotionName.Values:
SUMofGlance ViewsSUMofUnits SoldSUMofRevenue
Sort: Sort by "SUM of revenue" in descending order.
Result: You now have a single, ranked leaderboard of your best- and worst-performing promotions. You can immediately see which ones drove sales and which ones were just-clicked (high Glance Views, low Units Sold).
Template 2: Compare Promotion Types (Deal vs. Lightning Deal)
This report answers: "What type of promotion drives the most sales for my brand?"
Create another Pivot Table.
Rows: Add
Type(This field contains data like "BEST_DEAL", "LIGHTNING_DEAL").Values:
SUMofRevenueAVERAGEofRevenue(to see the per-promo impact)SUMofUnits Sold
Result: You can now definitively say, "Lightning Deals generate more total revenue, but Best Deals have a higher average revenue per promotion." This insight can guide your entire marketing budget.
Template 3: Track True Profitability (Advanced)
This report answers: "Which promotions were actually profitable?"
This report gives you Revenue, but not Profit. To find profit, you must combine it with other data.
Sync your Amazon Settlement Report using Hopted into a new tab. This gives you your FBA fees and Amazon commissions.
In your "Promotions" tab, add a column for your
COGS(Cost of Goods Sold) for eachASIN.Use
VLOOKUPorINDEX/MATCHto pull theFBA Feesfrom your Settlement tab.Create a new column:
Total Cost=(COGS * unitsSold) + (FBA_Fees * unitsSold) + (revenue_lost_to_discount)Create a final column:
Profit=revenue-Total Cost
Result: You now have a true profit-and-loss (P&L) statement for every single promotion you run, all automated within your spreadsheet.
Common workflows this report unlocks
Deal ROI leaderboard: Revenue per promotion day; units sold per 1,000 glance views.
ASIN lift report: Promotion revenue minus prior 7-day average for the same ASIN/marketplace.
Timing effectiveness: Start time vs. units in first 6 hours (pull hourly via sheet clock if you append).
Marketplace mix: Shares of units by marketplace over the promo window.
FAQ about Amazon Promotions Performance
Q: Why is today’s promo missing today’s sales?
The report updates daily and shows data through the previous day.
Q: Which promotions are included?
Sellers: Best Deal, Lightning Deal. Vendors: Best Deal, Lightning Deal, Price Discount.
Q: Can I analyze orders without scripts?
Yes—Hopted writes clean, normalized rows to your sheet, ready for pivots and formulas.
Q: How is Hopted different from other Amazon seller software?
Most Amazon tools force you into their rigid dashboards and pre-built reports. You have to change your workflow to fit their software. With Hopted is the opposite. It’s a flexible data automation layer that works directly inside your existing spreadsheets (like Google Sheets). Instead of forcing you to learn a new system, Hopted brings all your scattered Amazon data (sales, inventory, promotion performance, etc.) right to you. You can build the fully custom reports and automations you need, not the ones a rigid tool dictates.
Q: How is this different from the Advertising (PPC) reports? This report is for Promotions (e.g., Buy One Get One, 15% Off) found under the "Advertising" tab. It is not for your PPC (Sponsored Products, Sponsored Brands) ad campaigns, which are separate reports. Hopted can sync those, too!


Hopted,
explained.
Watch the film