Traffic is vanity, sales are sanity, but conversion is king. If you don't know how many people visited your listing versus how many actually bought, you are flying blind. The Sales & Traffic by Child ASIN Report (listing Detail Page Sales and Traffic) is the most powerful analytical tool in your arsenal. It breaks down performance not just by product, but by variant (Color, Size, Style) and by device (Mobile vs. Browser). This guide shows you how to automate your marketing intelligence. We'll cover how to automatically pull your Sales & Traffic report directly into Google Sheets to build a live "Conversion Rate Optimization" (CRO) dashboard.

How to Automatically Sync & Import the Sales & Traffic Report to Google Sheets (The Hopted Way)
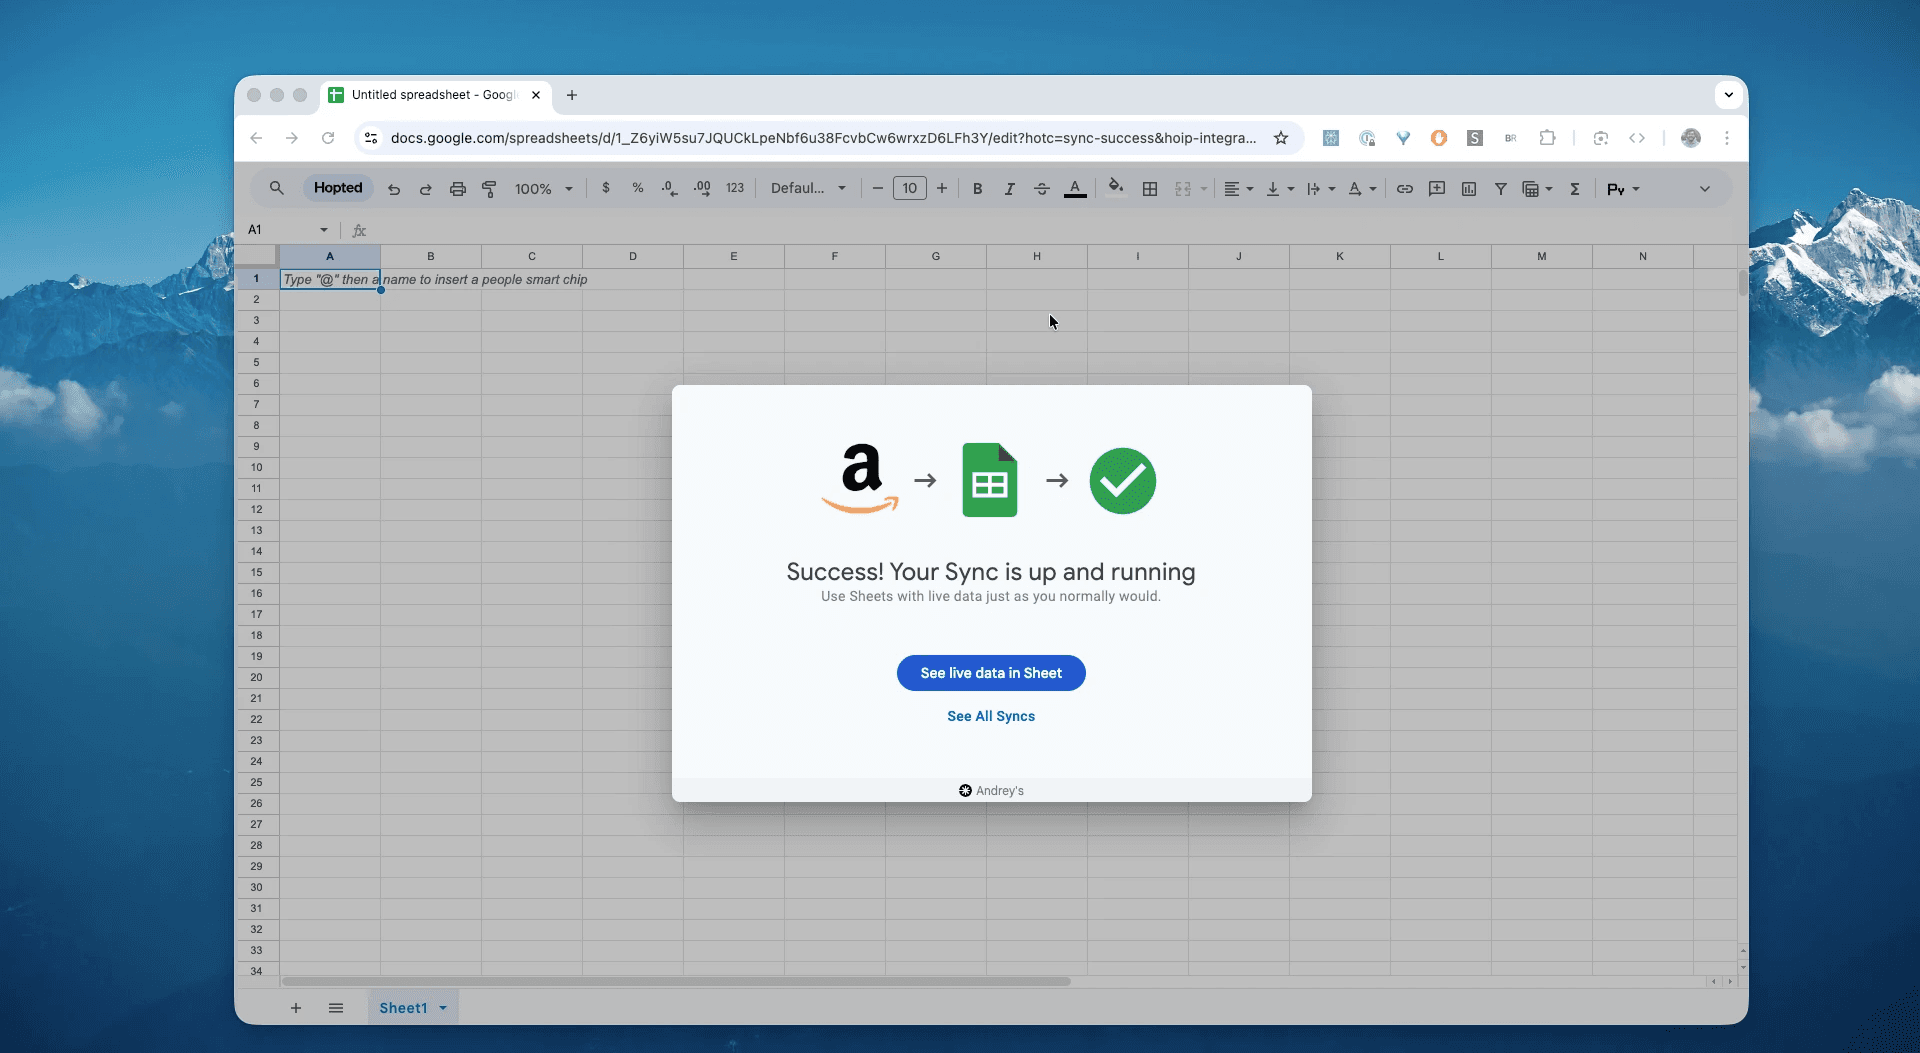
Using an Amazon to Google Sheets integration like Hopted, you set up the connection once, and your data flows automatically.
Step 1.
Install the Hopted browser extension and sign in using your Google Account.
Step 2.
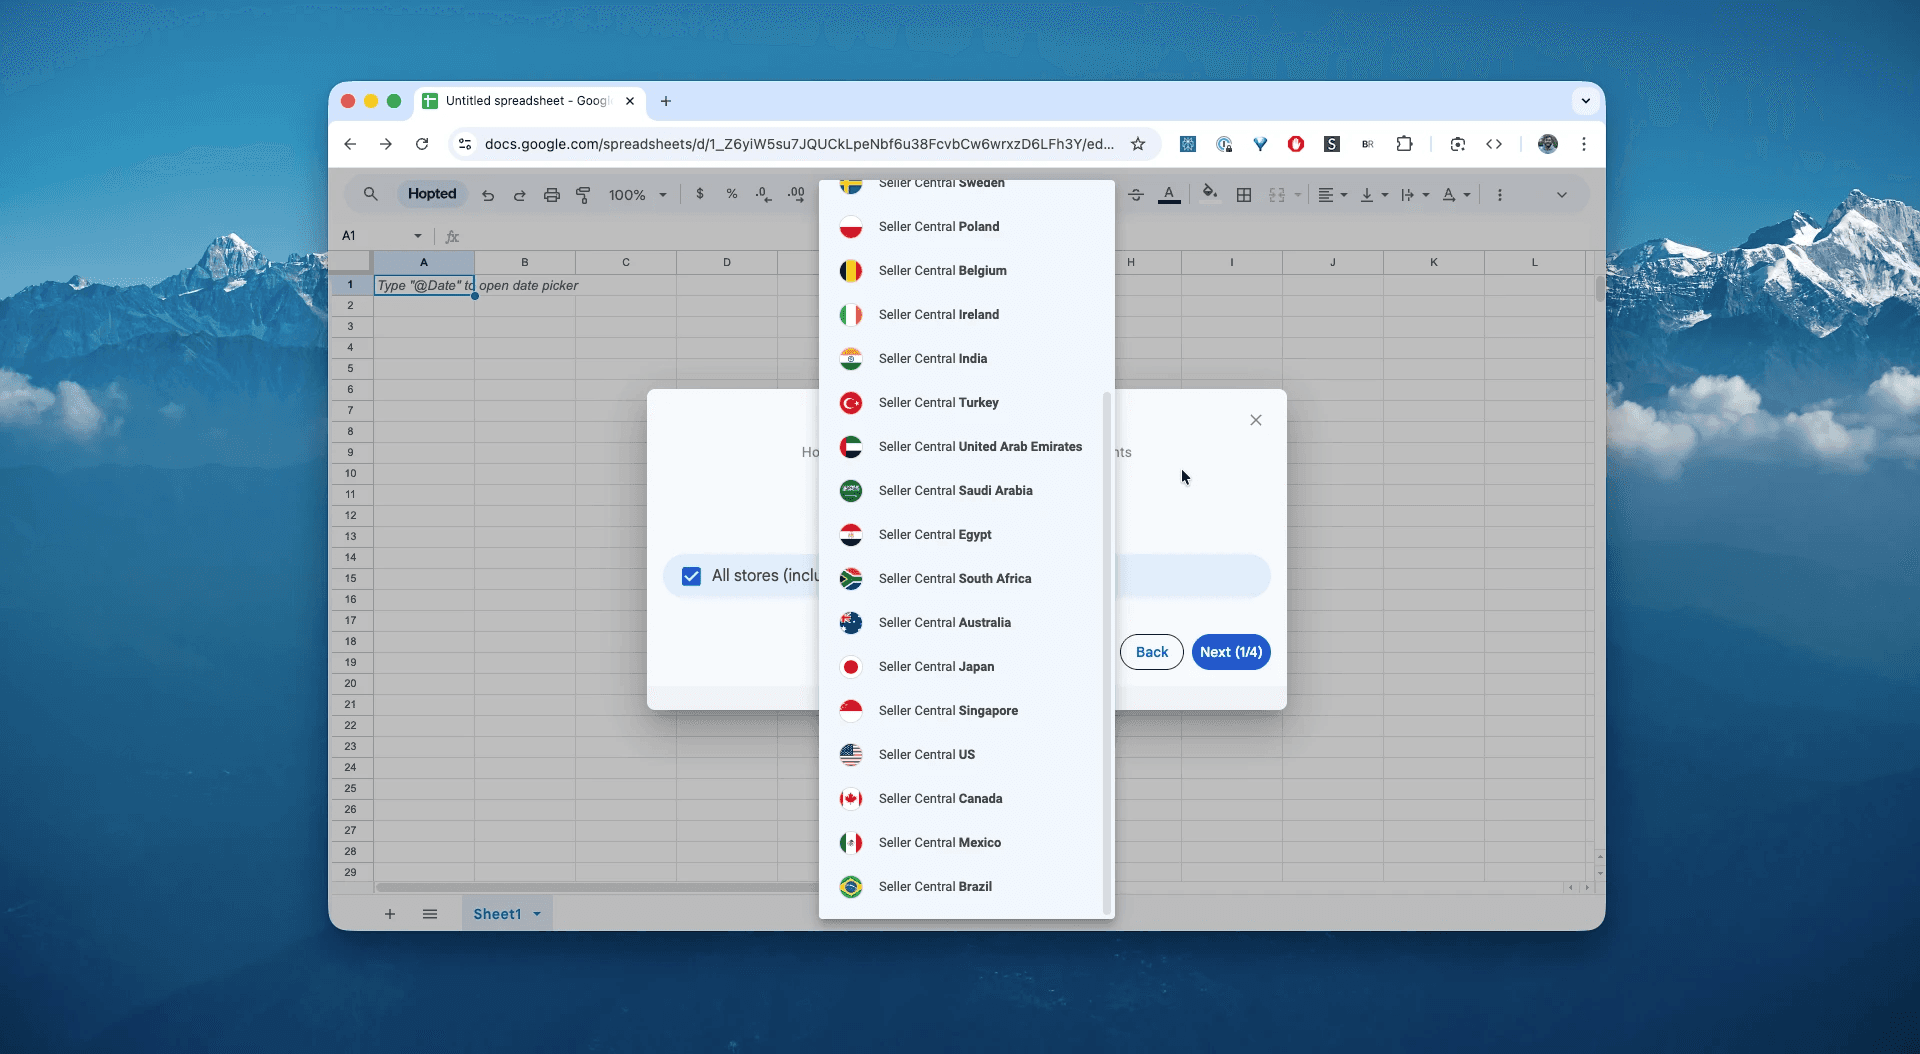
Securely connect your Amazon Seller Central to Google Sheets using Hopted's integration wizard.
Step 3.
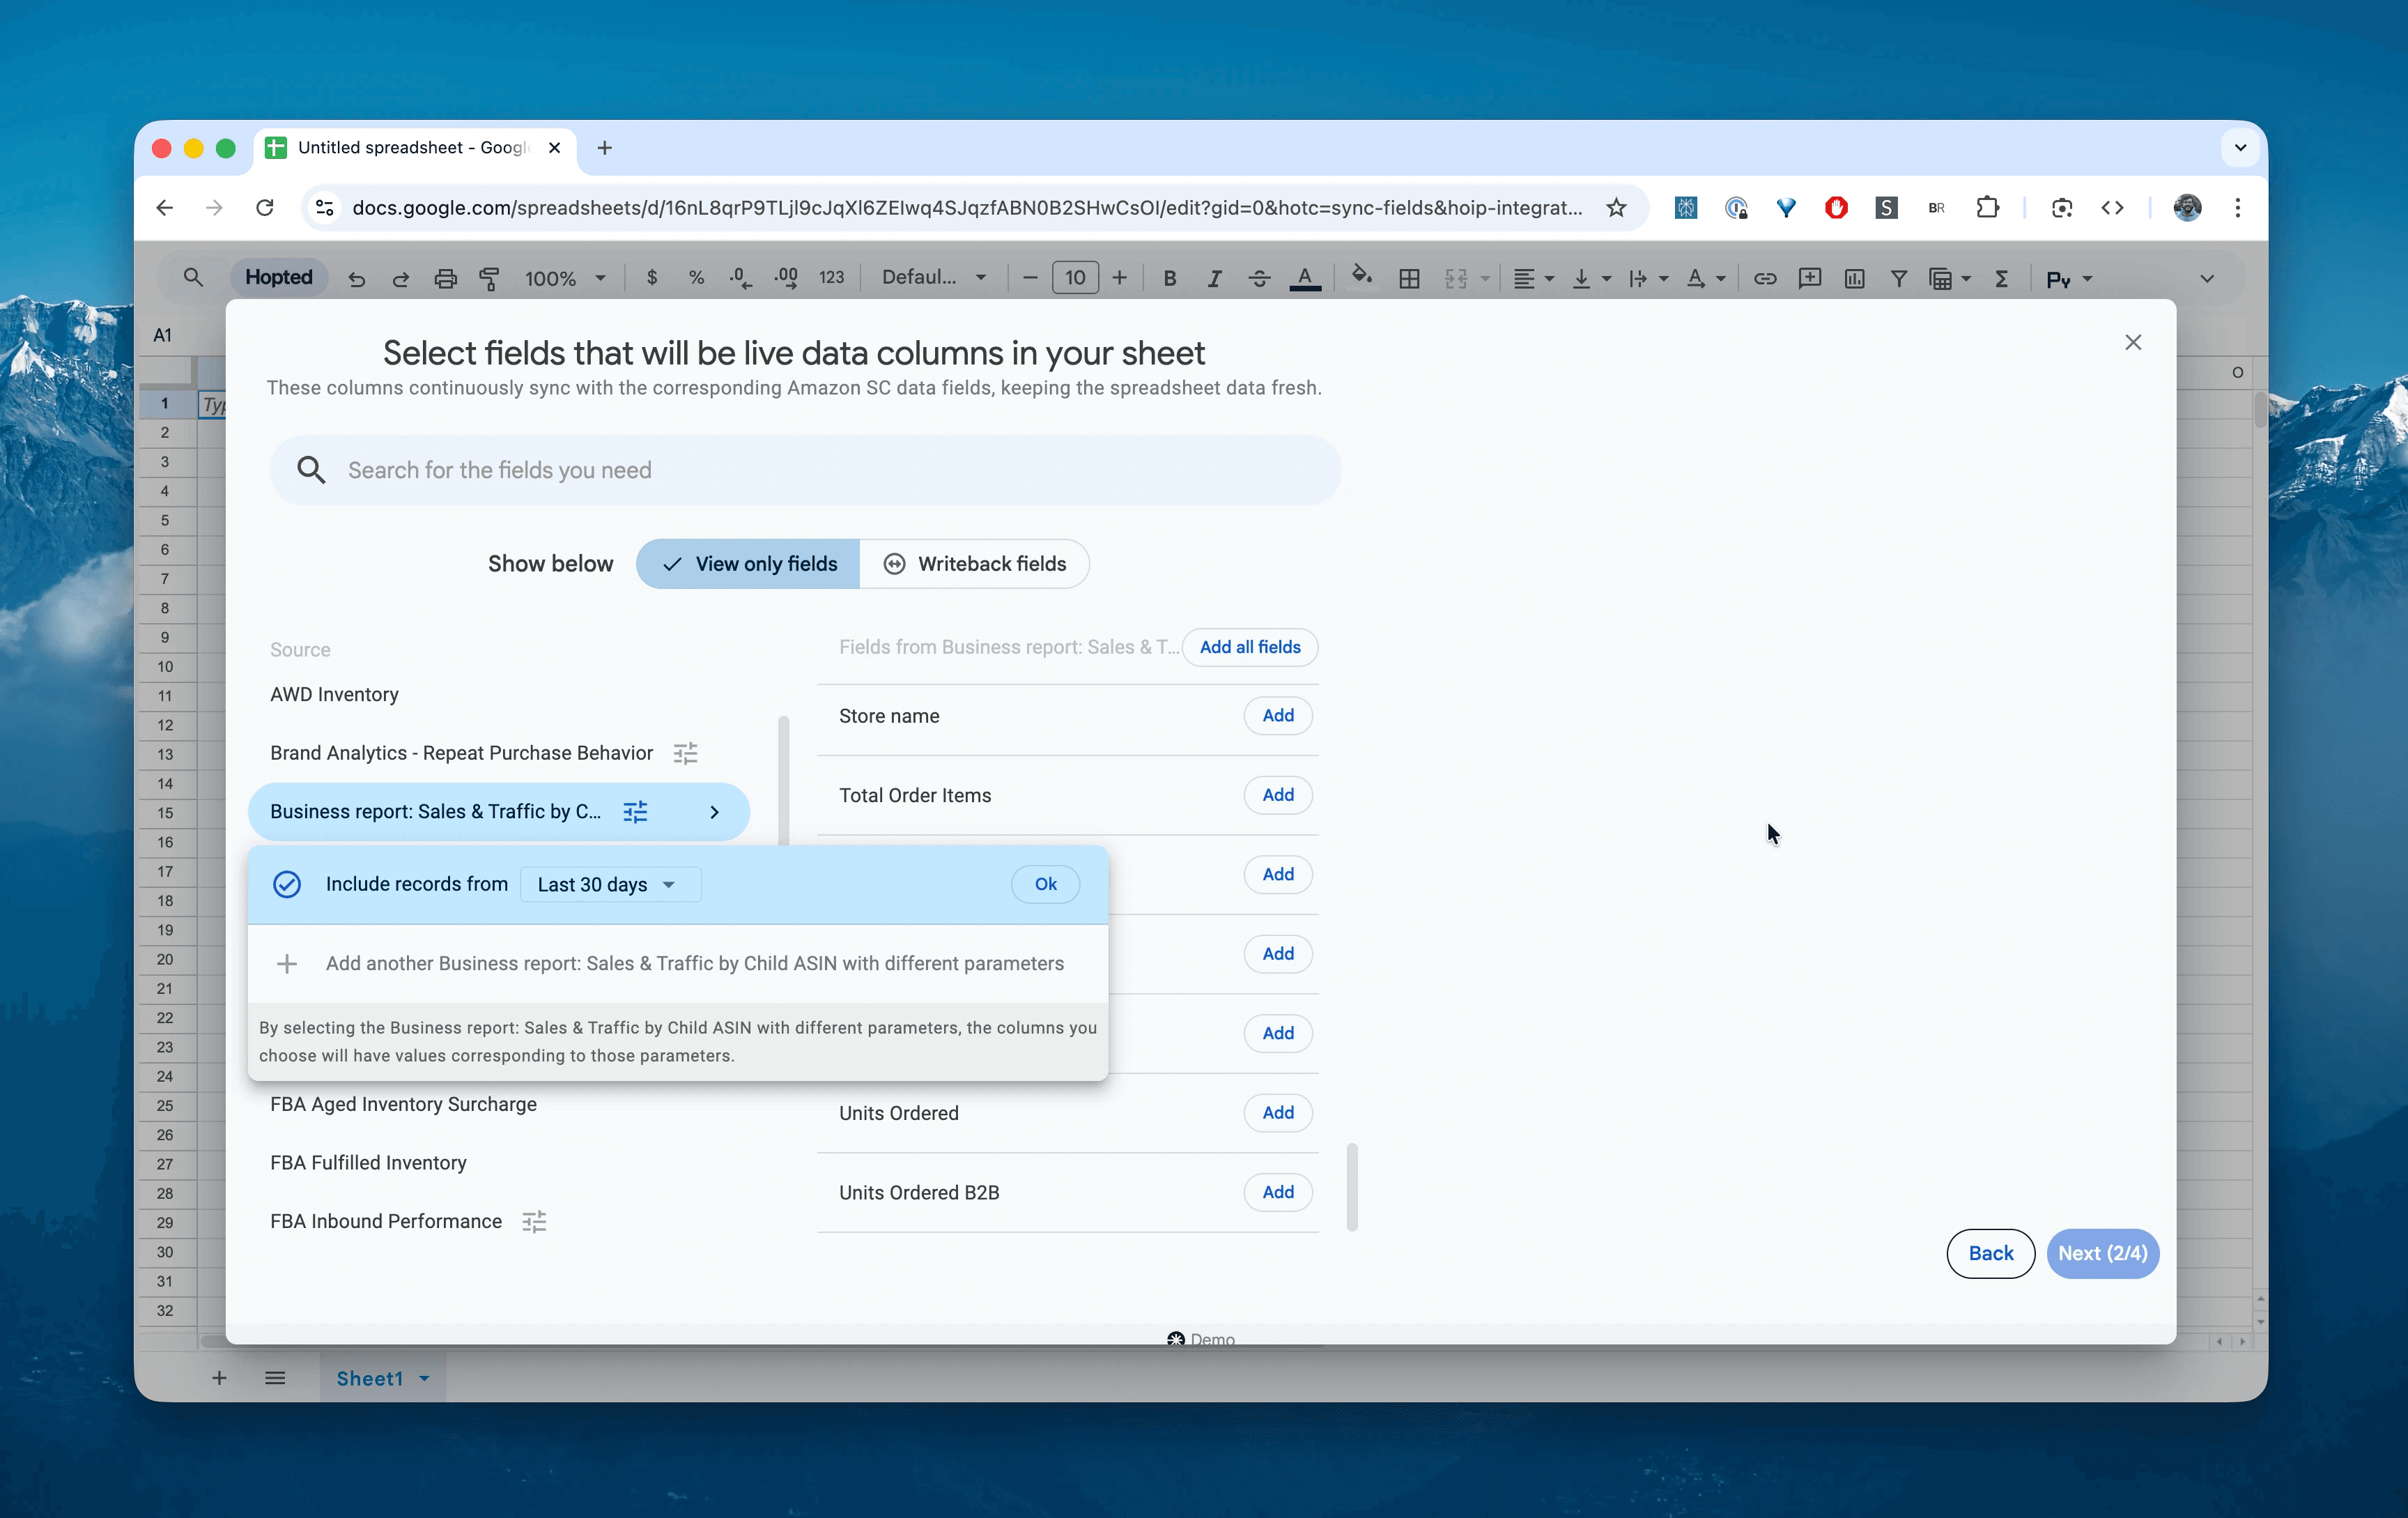
In Google Sheets, from the list of available Amazon Seller Central reports, select "Business report: Sales & Traffic by Child ASIN" for a specific date range. This can be as recent as the "Last 24 hours" or a custom range going as far back as 730 days. For this example, we'll select "Include records for the last 30 days".
Step 4.
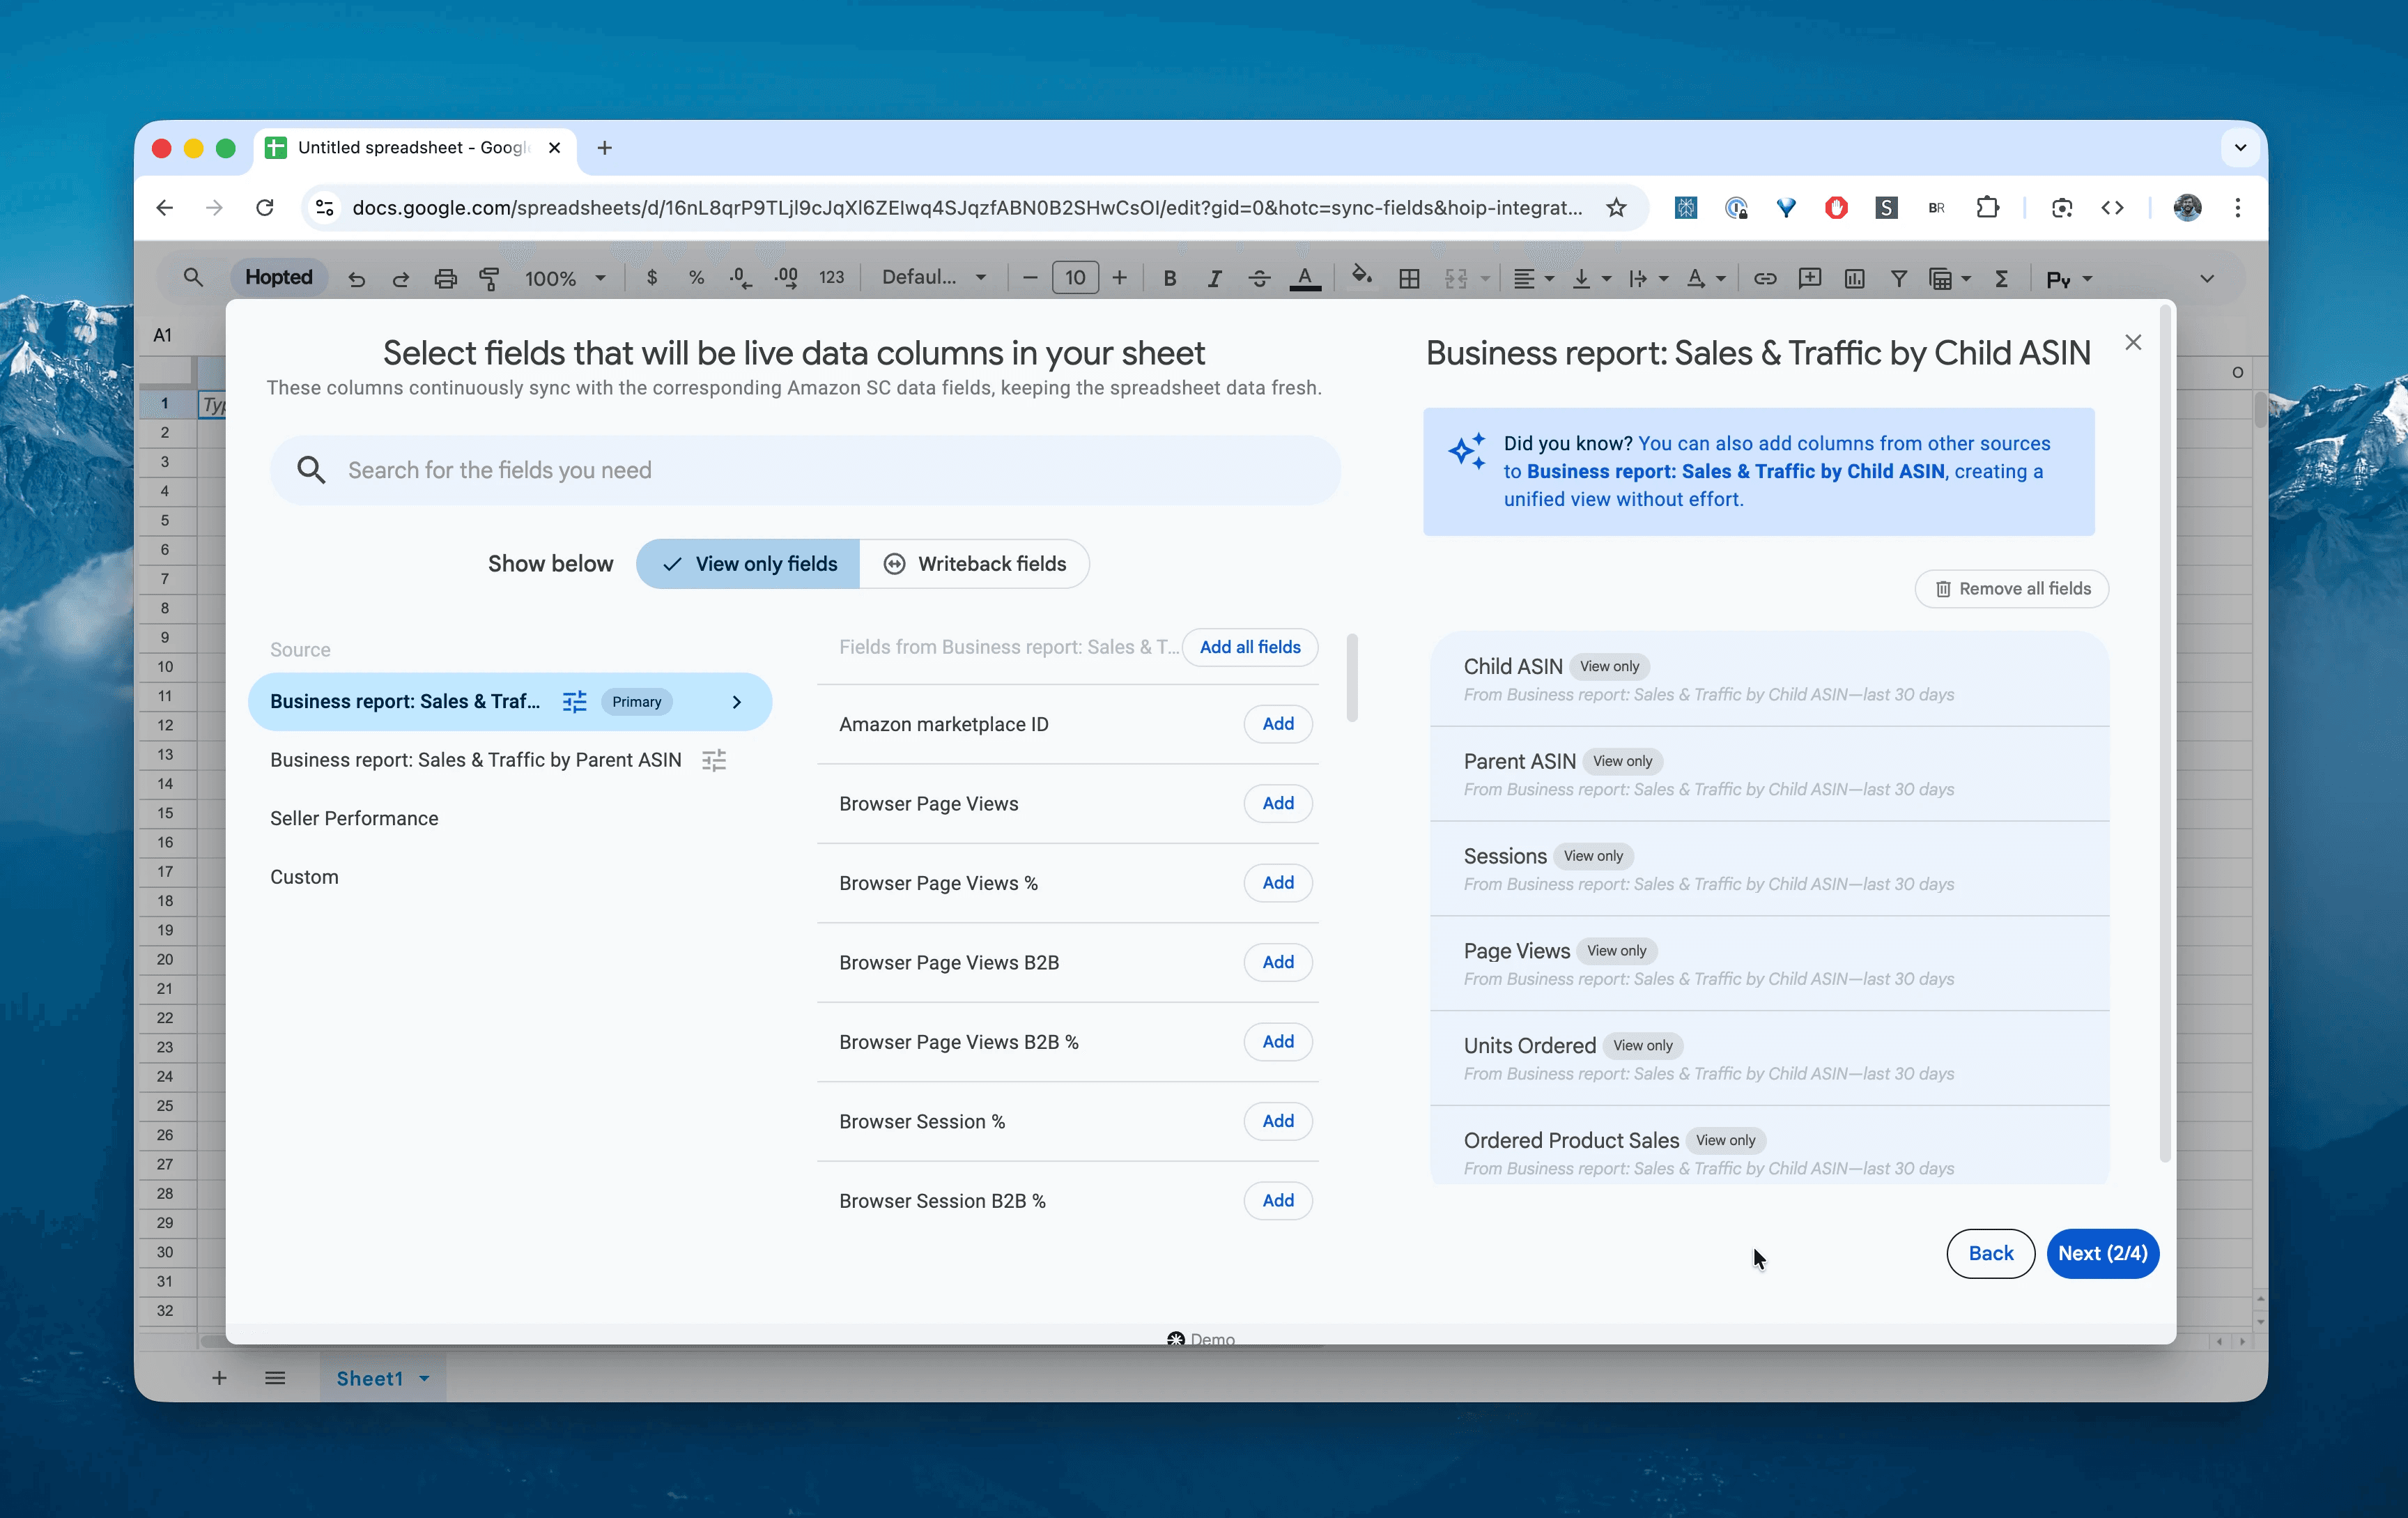
Select the critical columns for analysis: Child ASIN, Parent ASIN, Sessions, Page Views, Units Ordered, Unit Session %, Ordered Product Sales, Buy Box %, Mobile App Sessions, and Browser Sessions.
Step 5.
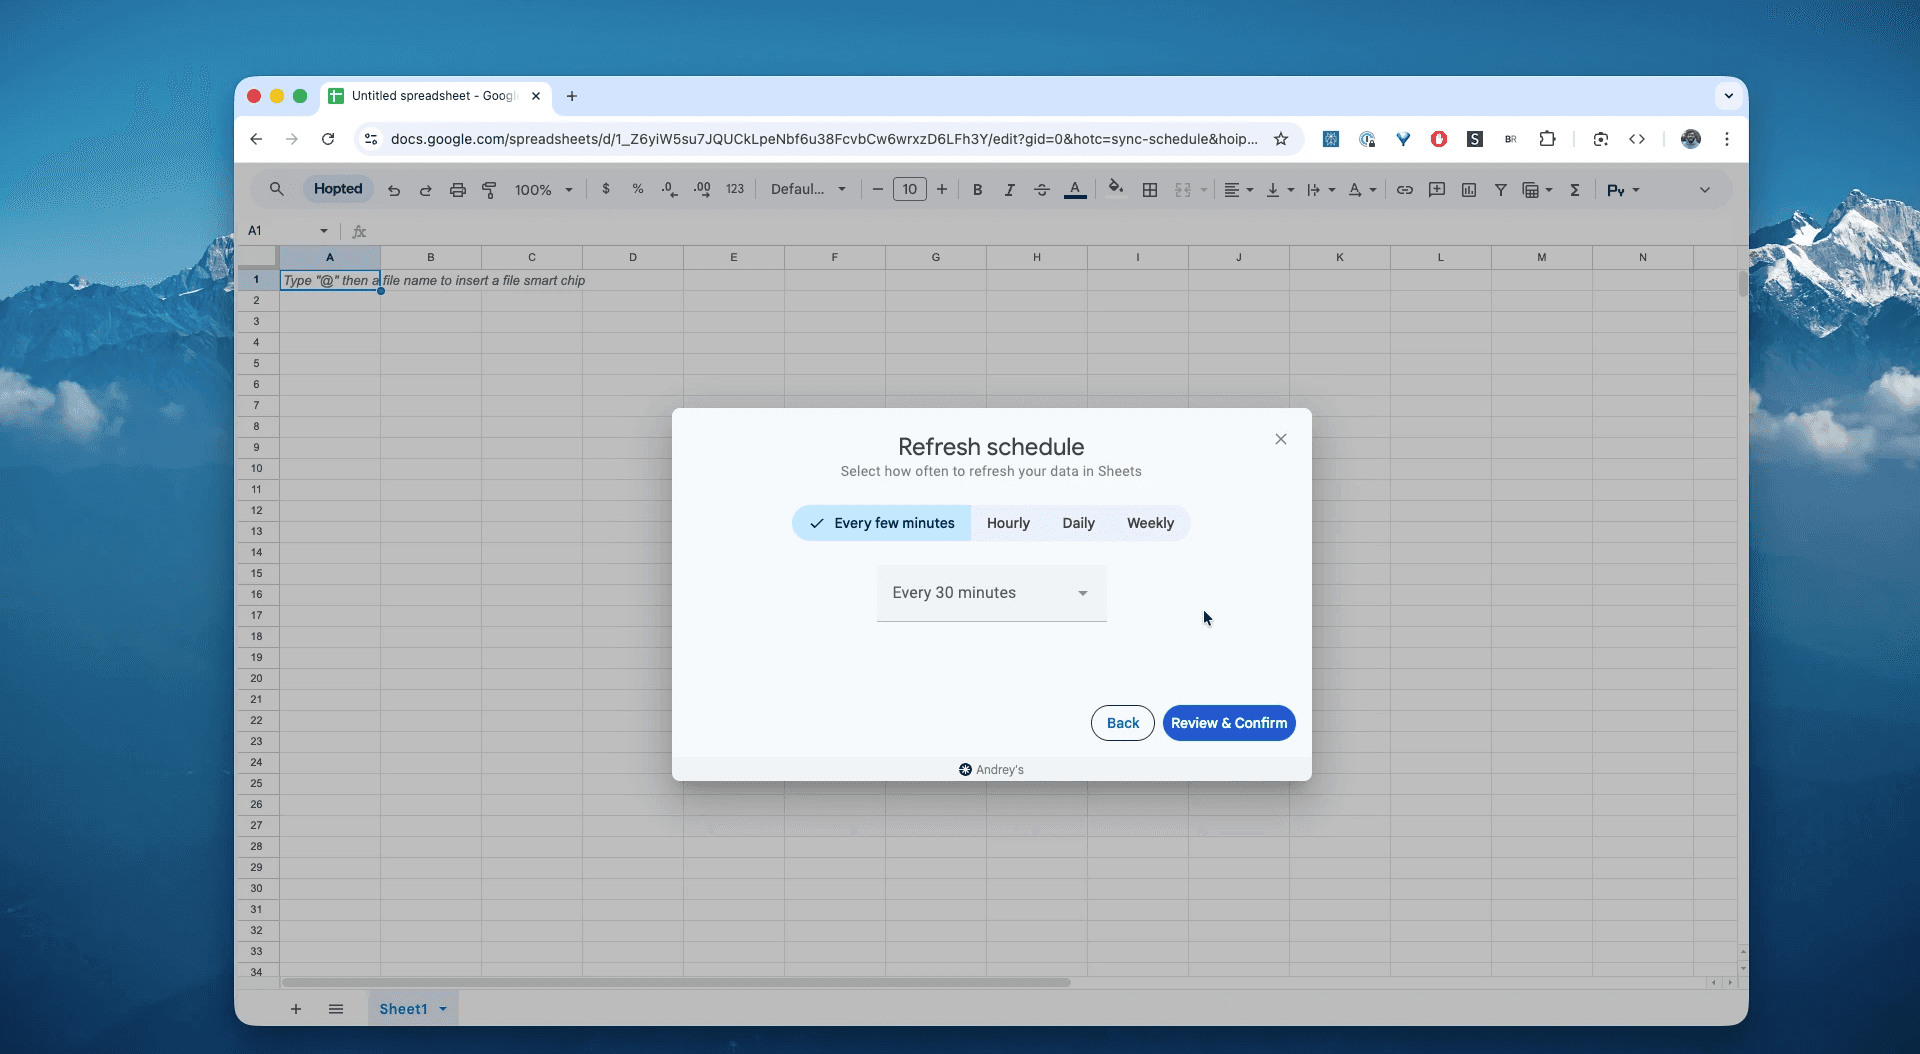
Set your schedule. Choose how often you want to export and refresh your traffic data. We recommend a Daily or Weekly schedule. Unlike inventory reports, this data changes retrospectively as Amazon attributes sales, so a weekly refresh often provides the most accurate "settled" data.
Step 6.
Save your data pipeline. This will export your Business Reports from Seller Central into spreadsheets instead of dealing with manual downloads. Your conversion tracking will be up to date forever.
What is the Amazon Sales & Traffic by Child ASIN Report?
This report provides the granular performance metrics for every individual child SKU in your catalog. Unlike the "Orders" report (which tracks transactions), this report tracks Behavior.
It answers the "Why": Why did sales drop? Was it because fewer people clicked (Traffic problem), or because people clicked but didn't buy (Conversion problem)?
Uniquely, this report includes the Mobile App vs. Browser split, allowing you to see if your listing performs differently for desktop shoppers versus mobile shoppers.
This makes it the single source of truth for answering questions like:
Which specific color variation (Red vs. Blue) has the highest conversion rate?Is my "Blue Widget" getting traffic but failing to convert (High Sessions, Low Unit Session %)?Do I have a "Mobile Optimization" problem where desktop users buy, but app users bounce?Are business customers (B2B) buying my product in bulk, even if consumer sales are slow?Did my recent price increase cause my Buy Box % to drop?
How to Analyze & Track Your Sales & Traffic in Spreadsheets
Now that you have a live feed, you can move from data entry to data analysis. This is the real power of analyzing your Amazon Seller Central data in spreadsheets and building your Amazon excel-like template.
Here are 3 Amazon spreadsheet template ideas you can build immediately:
Template 1: The "Variant Hero" Matrix (Parent/Child Analysis)
If you sell clothing or multi-pack items, some variants carry the team while others drag it down.
Pivot Table Rows:
Parent ASIN->Child ASIN.Values:
SUM of Sessions,AVERAGE of Unit Session %,SUM of Ordered Product Sales.The Insight: You might find that the "Small" size gets 80% of the traffic but has a 5% conversion rate, while "Large" gets little traffic but converts at 25%.
Action: Direct your PPC ad spend specifically to the "Large" variant to get a better ROAS (Return on Ad Spend).
Template 2: The "Ghost Traffic" Alert (Wasted Spend)
High traffic with zero sales is the fastest way to burn cash.
Filter:
Sessions> 500 ANDUnit Session %< 3% (or your category average).What it shows you: Listings that are attracting clicks but failing to close the deal.
Action: Immediate review of Price, Review Rating, or Listing Content. Stop PPC ads on these ASINs until the listing is fixed.
Template 3: The "Buy Box Loss" Emergency Alert
The Problem: You lose the Buy Box (to a hijacker, OOS, or price war) and sales tank. Usually, you don't find out until 3 days later when you check your sales dashboard. The Fix: Use Google Sheets' native "Conditional Notifications" to email you the moment Hopted detects a drop.
How to build it:
Set Hopted to sync this report Daily.
In Google Sheets, select the column for
Buy Box %.Go to Tools > Conditional notifications > Add rule.
The Rule: Set the condition to "Is less than" and enter
0.90(90%).The Action: Enter your email address.
What happens: Every morning when Hopted updates your sheet, Google will automatically scan the
Buy Box %column. If any ASIN has dropped below 90%, you get an instant email listing the specific row. You can fix the price or fight the hijacker immediately.
Common workflows this report unlocks
B2B Opportunity Spotting: Sort by
Ordered Product Sales B2B. If a product has high B2B sales, create a "Business Price" or quantity discount tier to encourage bulk orders.Buy Box Monitoring: Track
Buy Box %over time. If it drops below 90% for a Private Label product, you have a hijacker or an inventory availability issue.SEO Audit: Track
Page Viewstrends. If page views are declining while your conversion rate stays steady, your problem is Keyword Ranking/SEO, not the product itself.
FAQ about Sales & Traffic by Child ASIN
Q: What is "Unit Session Percentage"? This is Amazon's term for Conversion Rate. It is calculated as Units Ordereddivided by Sessions. If 100 people visit your page (Sessions) and 5 people buy (Units), your Unit Session Percentage is 5%.
Q: What is the difference between "Sessions" and "Page Views"?
Session: One unique customer visit (within 24 hours). Even if they refresh the page 10 times, it counts as 1 Session. Use this for conversion tracking.
Page View: Every time the page loads. 1 customer refreshing 10 times = 10 Page Views.
Q: Why do I see B2B columns (Browser Page Views B2B)? Amazon Business is a massive marketplace. These columns track traffic specifically from customers logged in with an Amazon Business account. It helps you understand if your product appeals to professional buyers.
Q: Why is my Buy Box % not 100%? Even if you are the only seller, your Buy Box % can drop if:
You run out of stock (OOS).
Your price is too high compared to other sites (Amazon suppresses the Buy Box).
Your delivery time is too slow.
Q: What is the difference between "Amazon Business Reports" and "Fulfillment Reports"?
Business Reports (like Sales & Traffic) focus on Marketing: Sessions, Page Views, Conversion Rates, and Buy Box percentage. They tell you how customers interact with your listings.
Fulfillment Reports (like FBA Inventory) focus on Logistics: Stock levels, shipments, and storage fees. They tell you where your products are. You need both to run a profitable business.
Q: How do I download Amazon Business Reports automatically? Amazon does not provide an API for Business Reports in the same way they do for Orders, making them notoriously difficult to automate. Hopted solves this by automating the report generation and download process securely via your browser, syncing the data directly to Google Sheets without manual CSV exports.
Q: Why don't the sales in my Business Reports match my Payments Dashboard? This is a common confusion. Business Reports track "Ordered Product Sales" (when the customer clicks buy). Payments Reports track "Shipped Orders" (when the money changes hands). Because orders can be cancelled or shipped days later, these numbers will rarely match perfectly. Use Business Reports for trend analysis and Payments for accounting.
Q: What is "Unit Session Percentage" in Amazon Business Reports? This is Amazon's term for Conversion Rate. It is calculated as Total Units Ordered divided by Total Sessions. A higher percentage means more visitors are becoming buyers. If your Unit Session Percentage is low (e.g., < 5%), you likely need to improve your images, price, or reviews.
Q: Can I see historical data in Amazon Business Reports? Yes, Seller Central typically allows you to view data going back two years. By using Hopted to sync this data to Google Sheets, you can archive it indefinitely, creating a permanent record of your seasonal trends year-over-year.
Q: How is Hopted different from other Amazon seller software? Most Amazon tools force you into their rigid dashboards and pre-built reports. You have to change your workflow to fit their software. With Hopted it is the opposite. It’s a flexible data automation layer that works directly inside your existing spreadsheets (like Google Sheets). Instead of forcing you to learn a new system, Hopted brings all your scattered Amazon data (sales, inventory, orders, etc.) right to you. You can build the fully custom reports and automations you need, not the ones a rigid tool dictates.


Hopted,
explained.
Watch the film