Are your sales down because fewer people are visiting your store, or because fewer people are buying? If you can't answer that question instantly, you can't fix the problem. The Amazon Sales & Traffic by Date Report (often called the "Business Report Dashboard") is the only place to see the high-level health of your account over time. It tracks your aggregate performance by Day, Week, or Month, allowing you to spot seasonal trends, monitor account-wide conversion rates, and detect sudden drops in traffic. This guide shows you how to automate your daily pulse check. We'll cover how to automatically pull your Sales & Traffic by Date report directly into Google Sheets to build a live "Executive Dashboard."

How to Automatically Sync & Import the Sales & Traffic by Date Report to Google Sheets (The Hopted Way)
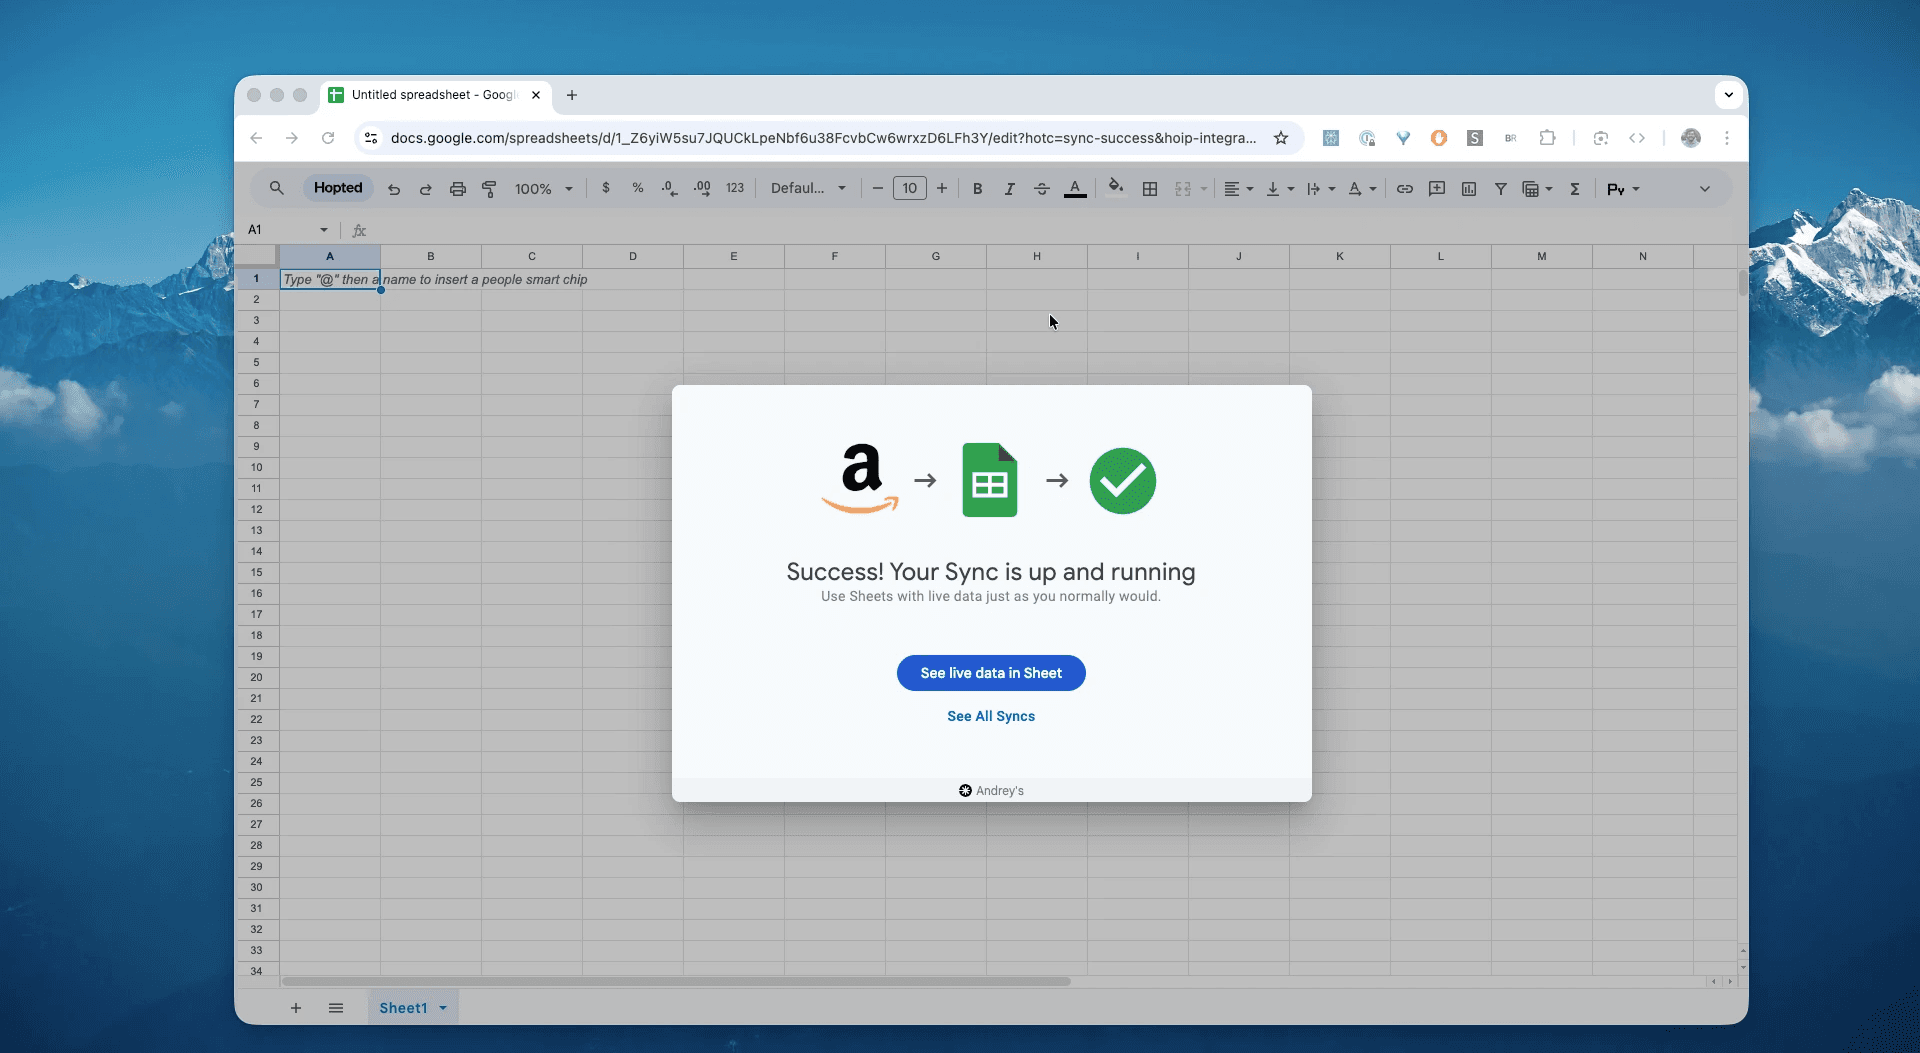
Using an Amazon to Google Sheets integration like Hopted, you set up the connection once, and your data flows automatically.
Step 1.
Install the Hopted browser extension and sign in using your Google Account.
Step 2.
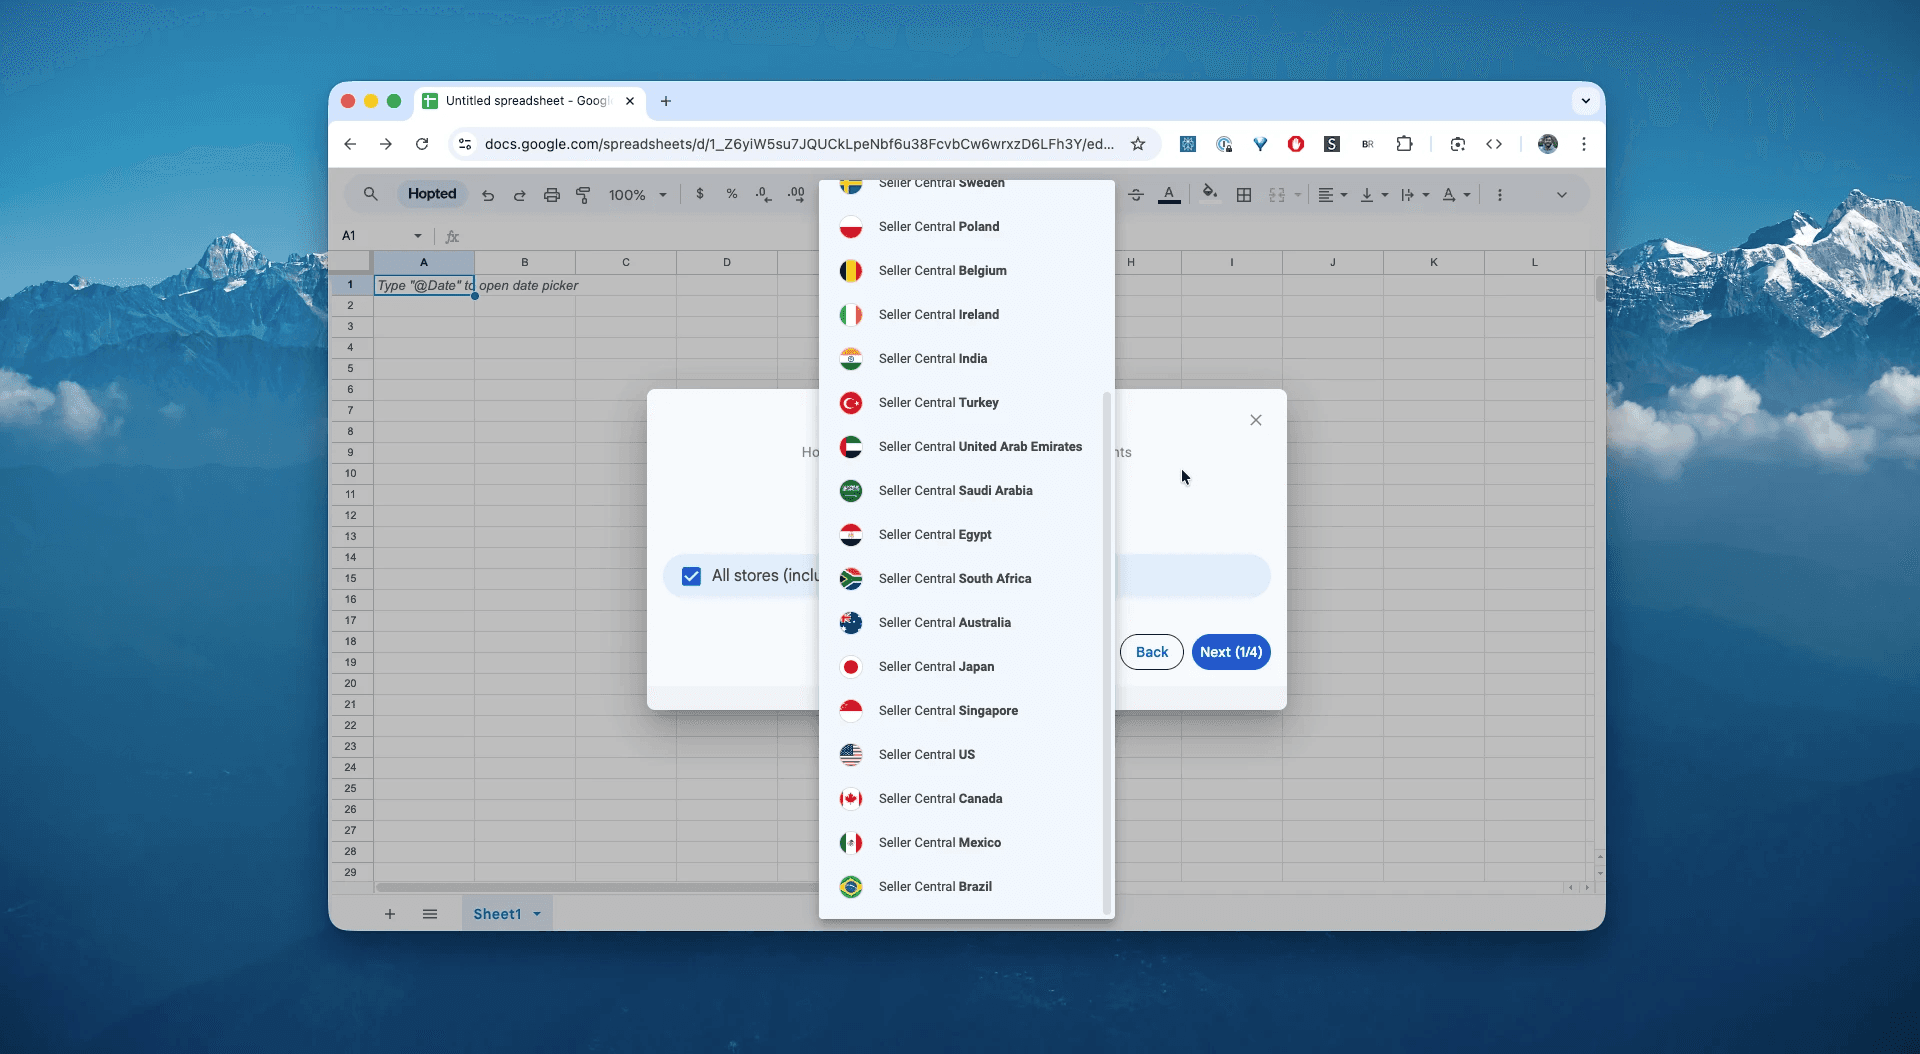
Securely connect your Amazon Seller Central to Google Sheets using Hopted's integration wizard.
Step 3.
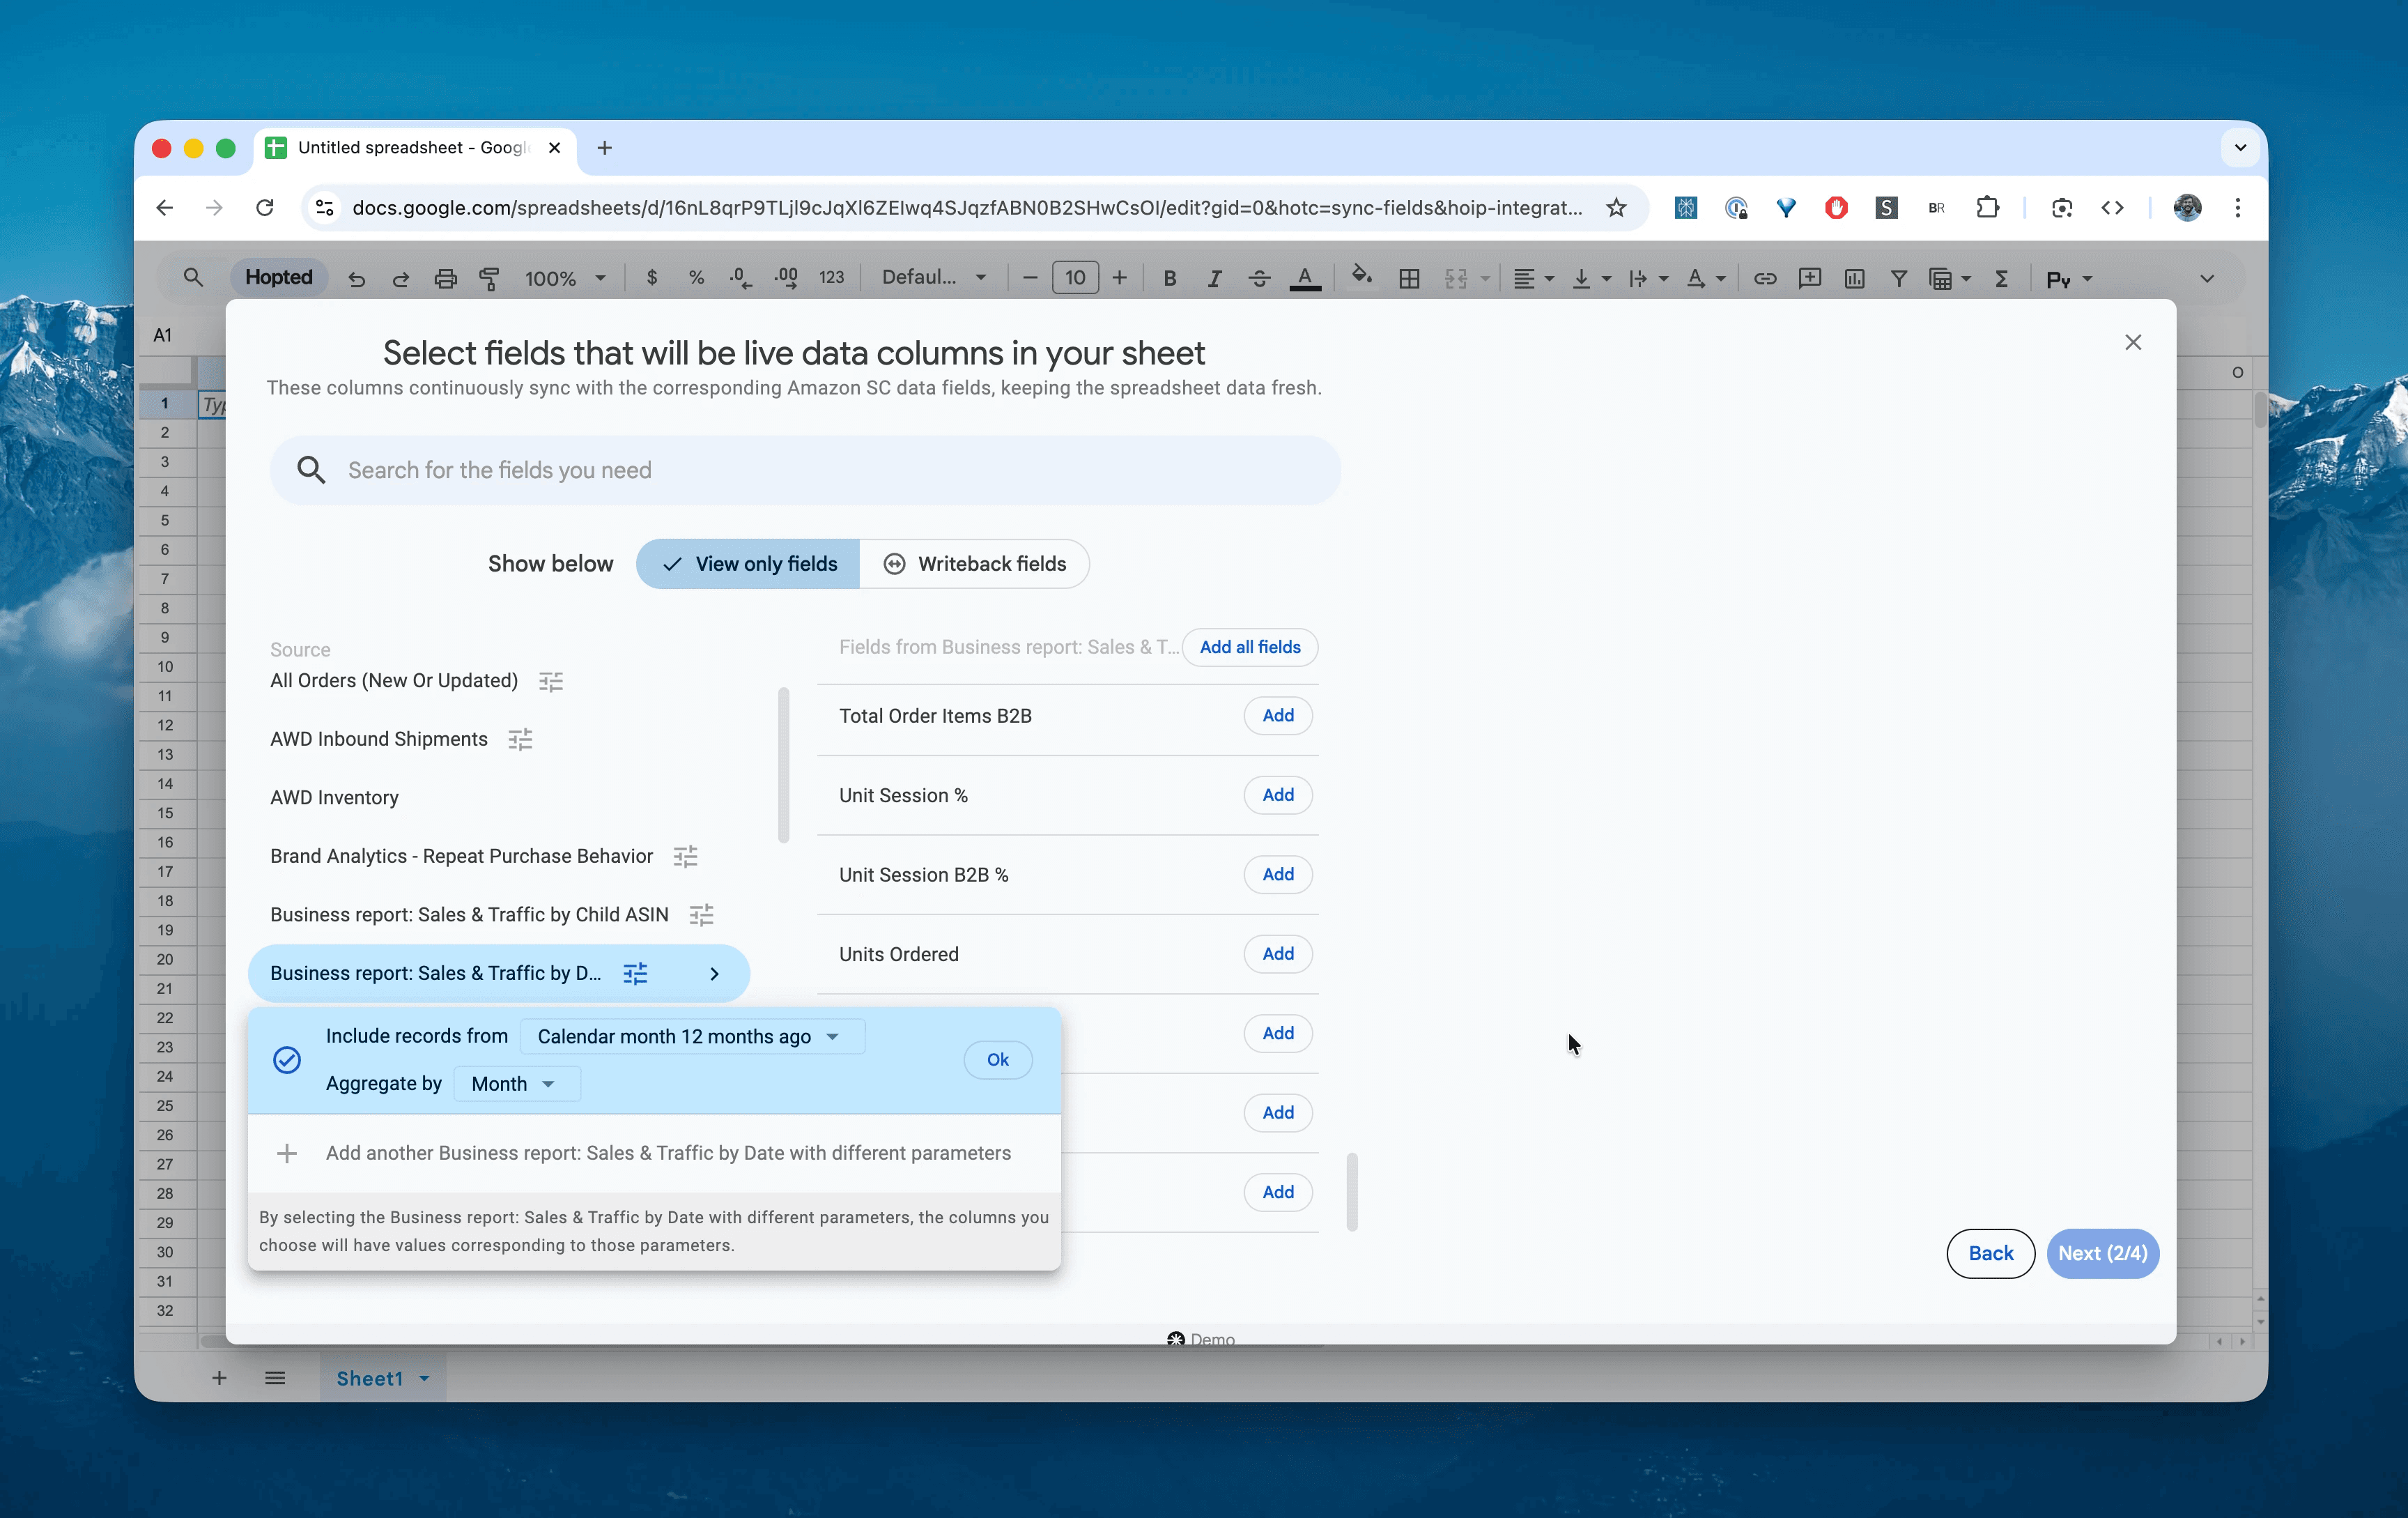
In Google Sheets, from the list of available Amazon Seller Central reports, select "Business Report: Sales & Traffic by Date" for a specific date range and aggregation. This can be as recent as the "Last 24 hours" or a custom range going as far back as 730 days. As well as options to aggregate your business data by day, week or month. For this example, we'll select "Include records for the last 12 months, by month".
Step 4.
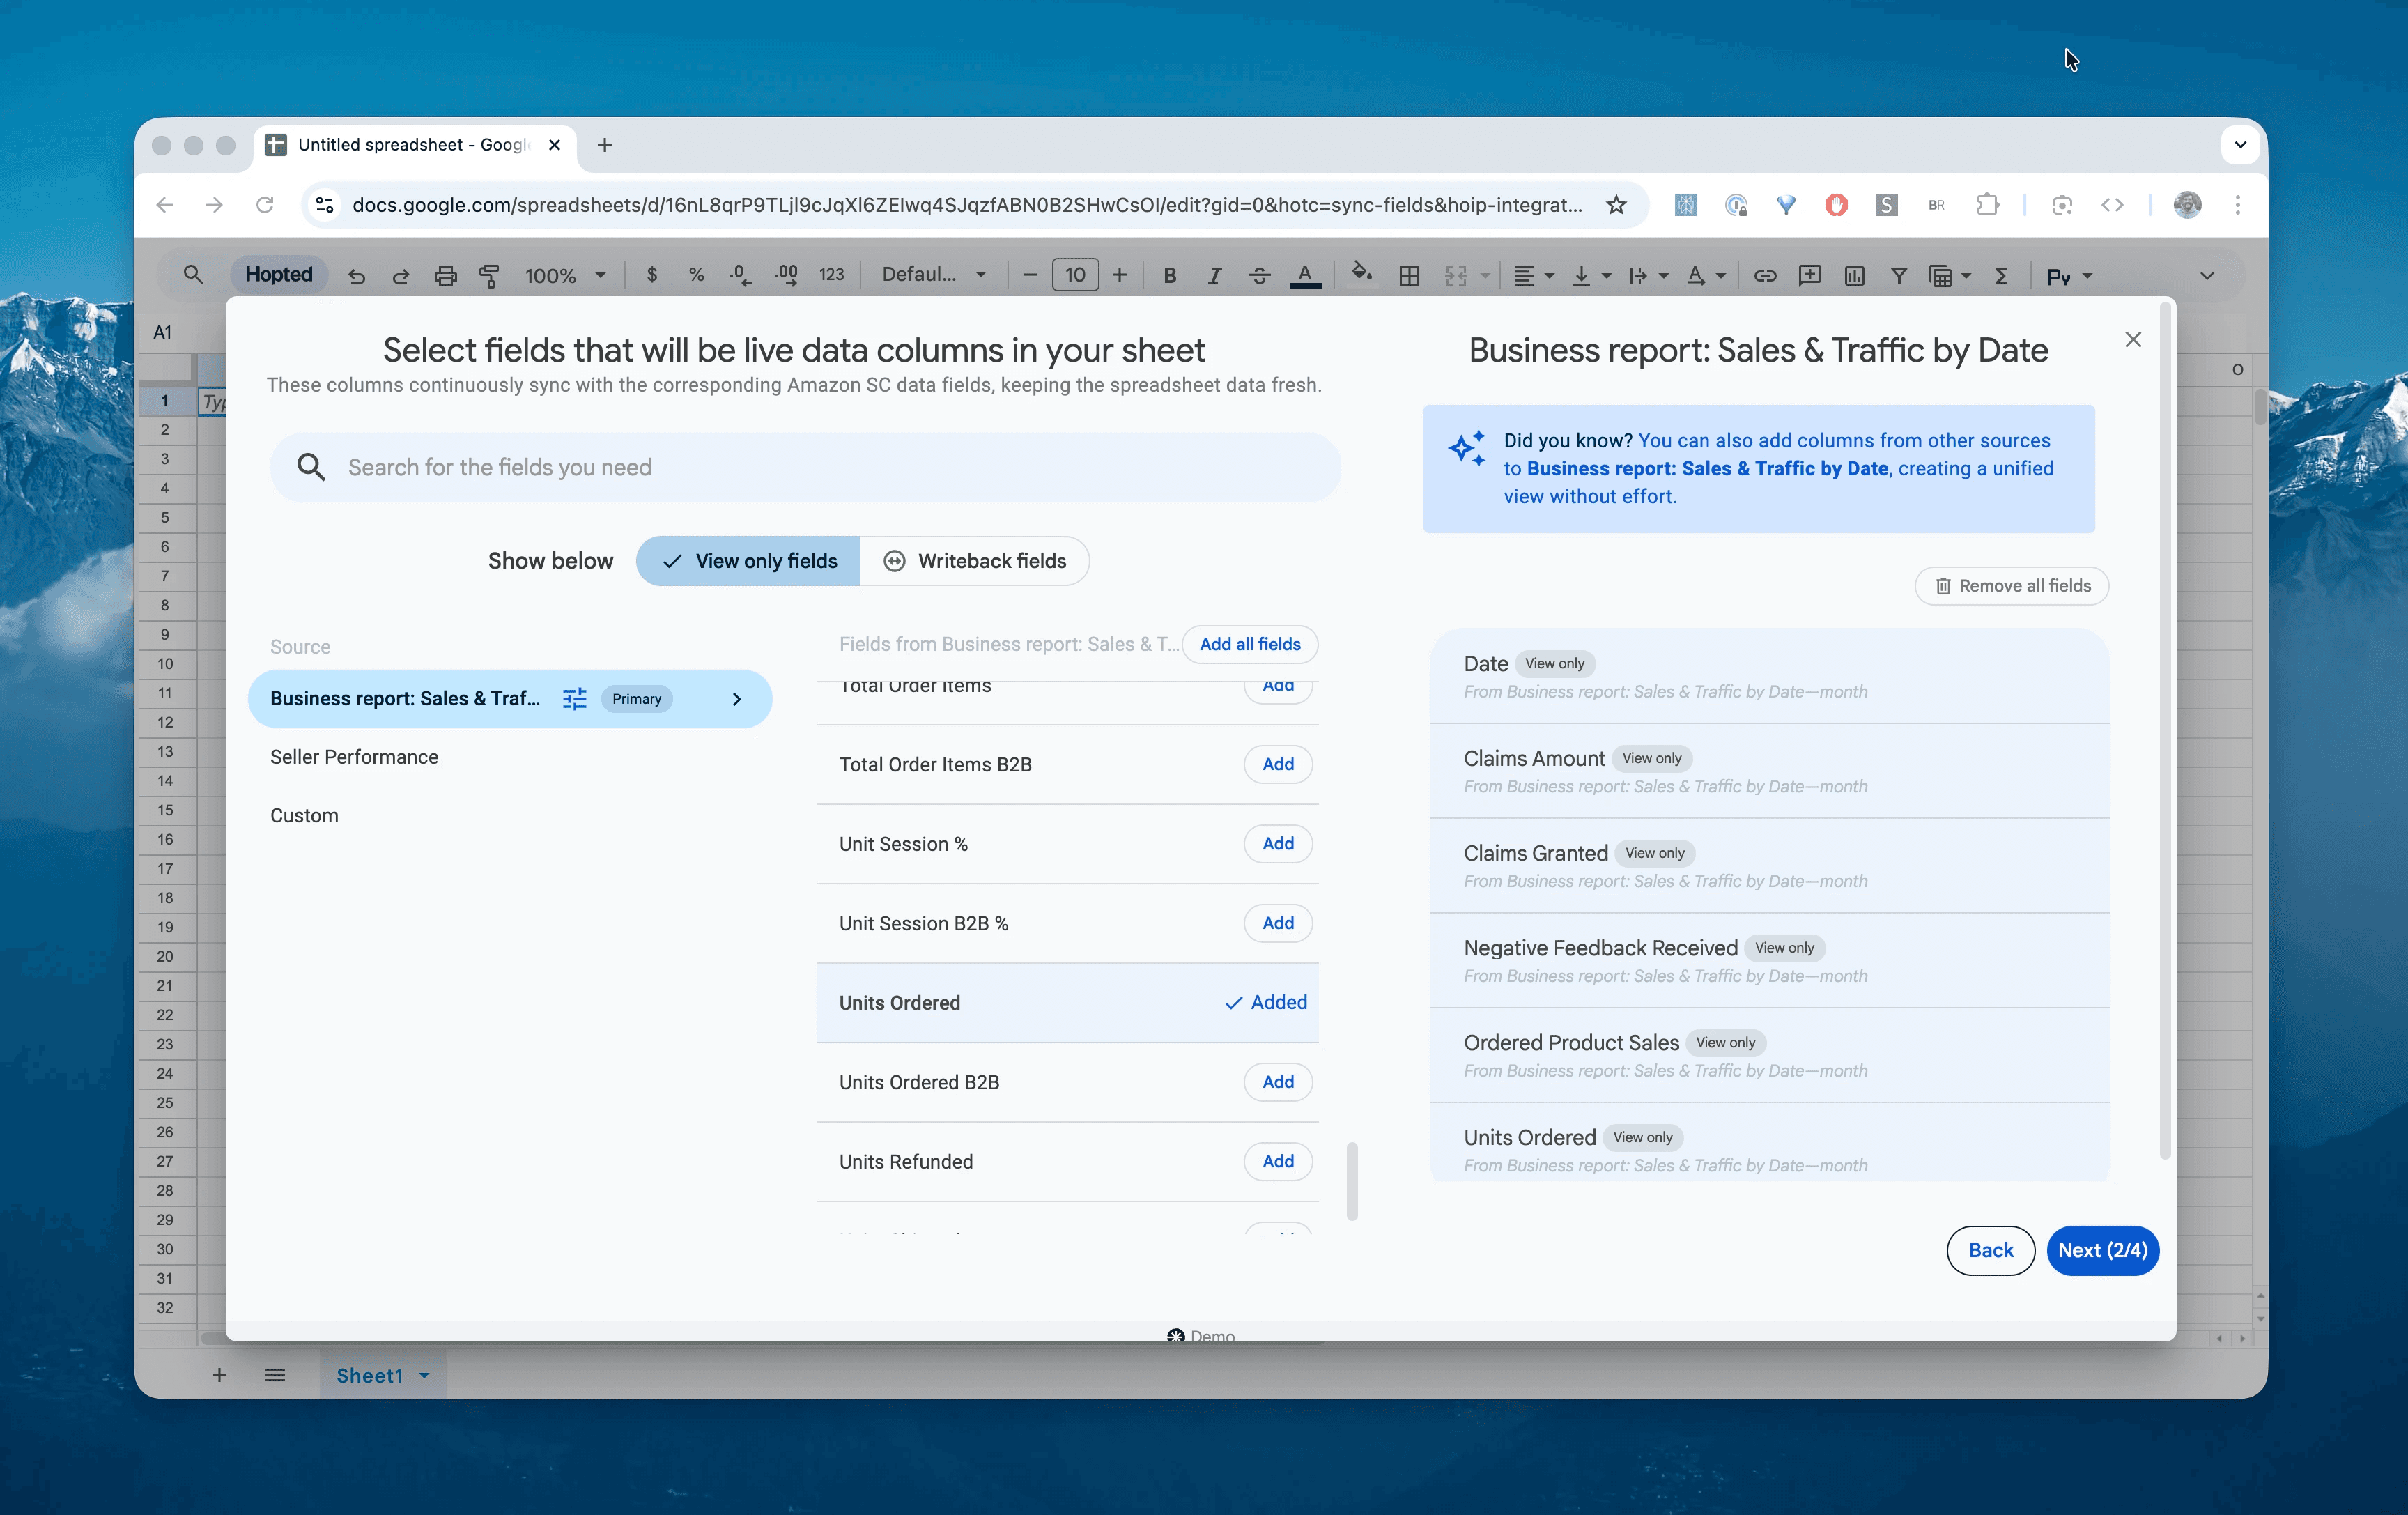
Select the critical columns for trend analysis: Date, Ordered Product Sales, Units Ordered, Sessions, Unit Session %, Buy Box %, Refund Rate, and Feedback Received.
Step 5.
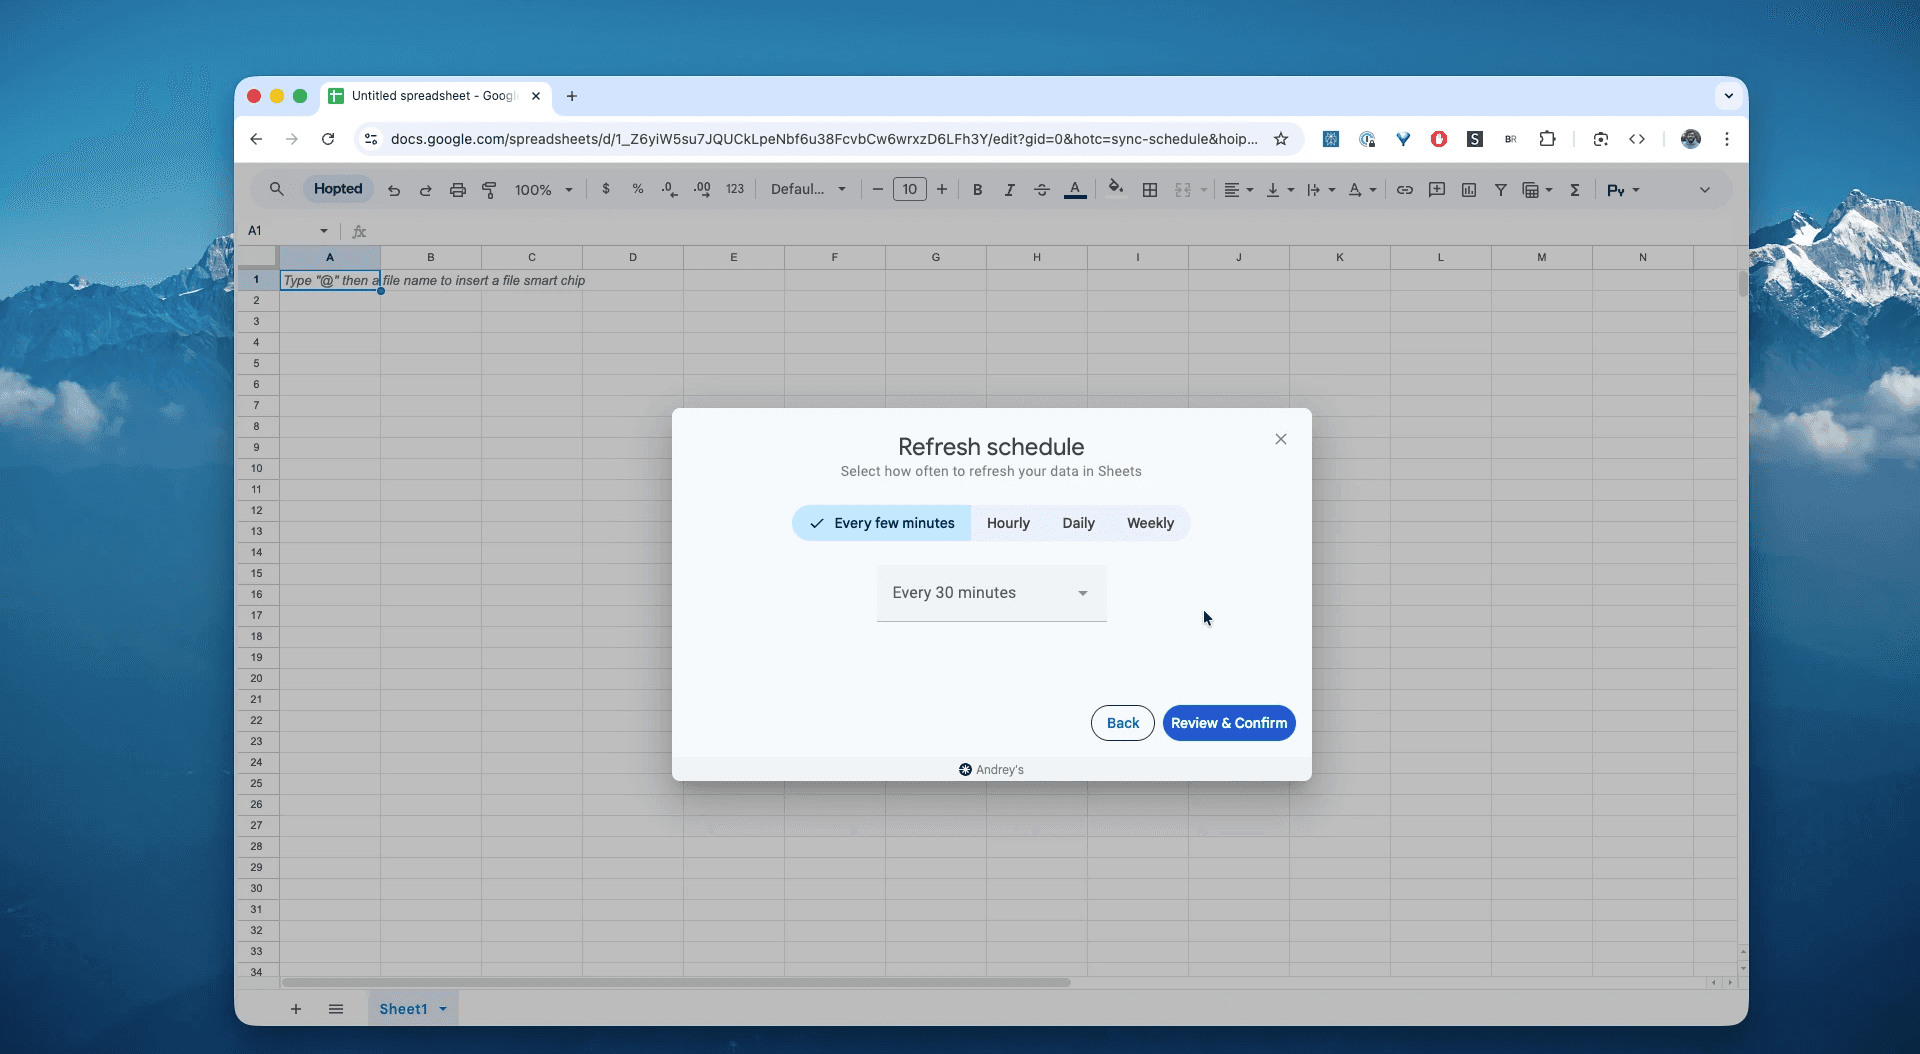
Set your schedule. Choose how often you want to export and refresh your business trends. We recommend a Daily schedule to capture yesterday's finalized numbers.
Step 6.
Save your data pipeline. This will export your account-level performance metrics from Seller Central into spreadsheets instead of dealing with manual downloads. Your growth tracking will be up to date forever.
What is the Amazon Sales & Traffic by Date Report?
This report is the timeline of your business. Unlike the "By ASIN" reports (which show you what sold), this report shows you when it sold and how the account performed as a whole.
It aggregates data across your entire catalog for a specific time period (Day, Week, or Month). This is crucial for understanding macro-trends that affect your entire brand, rather than just one product.
It uniquely combines Sales Metrics (Ordered Sales, Units) with Account Health Metrics (Negative Feedback, Claims Granted) and Traffic Metrics (Sessions).
This makes it the single source of truth for answering questions like:
Is my overall Conversion Rate (Unit Session %) trending up or down compared to last month?Did my total traffic (Sessions) crash on a specific day, indicating a technical issue or algorithm update?How does my "Buy Box %" average correlate with my daily sales volume?What is my actual Refund Rate across the entire account for financial planning?How do my B2B sales (Business to Business) fluctuate during the week vs. weekends?
How to Analyze & Track Your Sales Trends in Spreadsheets
Now that you have a live feed, you can move from data entry to data analysis. This is the real power of analyzing your Amazon Seller Central data in spreadsheets and building your Amazon excel-like template.
Here are 3 Amazon spreadsheet template ideas you can build immediately:
Template 1: The "Traffic vs. Conversion" Diagnosis
When sales drop, you need to know if it's a Traffic problem (Marketing) or a Conversion problem (Listing/Price).
Chart: Create a Dual-Axis Line Chart in Google Sheets.
Left Axis:
Sessions(Traffic).Right Axis:
Unit Session %(Conversion Rate).
The Insight:
If Sessions drop but Conversion stays flat: You lost keyword ranking or turned off ads.
If Conversion drops but Traffic stays flat: You have a price issue, a bad review, or a hijacker.
Template 2: The "Seasonality" Forecaster (730-Day Lookback)
Amazon allows you to pull data up to 2 years back. Use this to predict next month's inventory needs.
Pivot Table: Rows =
Month. Values =SUM of Units Ordered.Columns: Group by
Year.What it shows you: A side-by-side comparison of this month vs. the same month last year (YoY). If you grew 20% last year in November, you can forecast a similar lift this November.
Template 3: The "Refund Rate" Spike Detector
Refunds can kill your profitability. You need to track the rate, not just the number.
Formula: Create a column
True Refund Rate=Units Refunded/Units Shipped.Conditional Formatting: Highlight any day (or week) where the rate exceeds 5%.
What it shows you: A sudden spike in refund rate across the account usually indicates a bad batch of inventory arrived at FBA, or a misleading description on a best-selling product.
Common workflows this report unlocks
Financial Reconciliation: Compare
Ordered Product Sales(Demand) againstShipped Product Sales(Revenue) to understand your cash flow lag.Valuation & Exit Planning: Aggregators and investors want to see clean, 24-month trend lines of
SessionsandOrdered Sales. This report builds that data room automatically.Feedback Monitoring: Track
Negative Feedback Receivedrelative toOrders Shipped. If the ratio climbs, your account health is at risk of suspension.
FAQ about FAQ about Sales & Traffic by Date
Q: What is the difference between "Ordered Product Sales" and "Shipped Product Sales"?
Ordered Product Sales: The value of orders placed by customers at the moment of checkout. Use this for marketing performance (did the ad work?).
Shipped Product Sales: The value of orders that actually left the warehouse. Use this for accounting and cash flow (when do I get paid?).
Q: Can I get this data via the official Amazon SP-API? Technically, yes, but it is complex. The Amazon "GET_SALES_AND_TRAFFIC_REPORT" via API requires complex coding and data warehousing. Hopted simplifies this by providing a no-code interface to sync this exact data directly to Google Sheets without engineering resources.
Q: Why does "Buy Box %" matter on an account level? While Buy Box is usually a product-level metric, the account-level average tells you about your overall competitiveness. A steady decline in account-wide Buy Box % often indicates that your pricing strategy is becoming uncompetitive market-wide, or your ODR (Order Defect Rate) is hurting your eligibility.
Q: Does this report include B2B (Amazon Business) sales? Yes. Columns like Ordered Product Sales B2B and Units Ordered B2B show sales specifically to registered business buyers. This segment often has higher retention and larger order volumes.
Q: How far back does the data go? Amazon restricts this report to the last 2 years (730 days). If you don't export and save this data regularly, it is lost forever. Using Hopted to sync to Google Sheets allows you to build a permanent archive of your sales history beyond the 2-year limit.
Q: How is Hopted different from other Amazon seller software? Most Amazon tools force you into their rigid dashboards and pre-built reports. You have to change your workflow to fit their software. With Hopted it is the opposite. It’s a flexible data automation layer that works directly inside your existing spreadsheets (like Google Sheets). Instead of forcing you to learn a new system, Hopted brings all your scattered Amazon data (sales, inventory, traffic) right to you. You can build the fully custom reports and automations you need, not the ones a rigid tool dictates.


Hopted,
explained.
Watch the film