Running out of stock on Amazon is catastrophic. You don't just lose the sale today; you lose your organic ranking for weeks. On the flip side, sending too much stock hurts your IPI score and racks up storage fees. It is a delicate balancing act. The FBA Restock Inventory Report is Amazon's automated advice engine. It tells you exactly what to restock, how many units to send, and when to ship them. However, Amazon’s algorithm isn't perfect. This guide shows you how to export this data to build your own logic. We'll cover how to automatically pull your Restock Inventory report directly into Google Sheets to build a live "Replenishment Command Center."

How to Automatically Sync & Import the FBA Restock Inventory Report to Google Sheets (The Hopted Way)
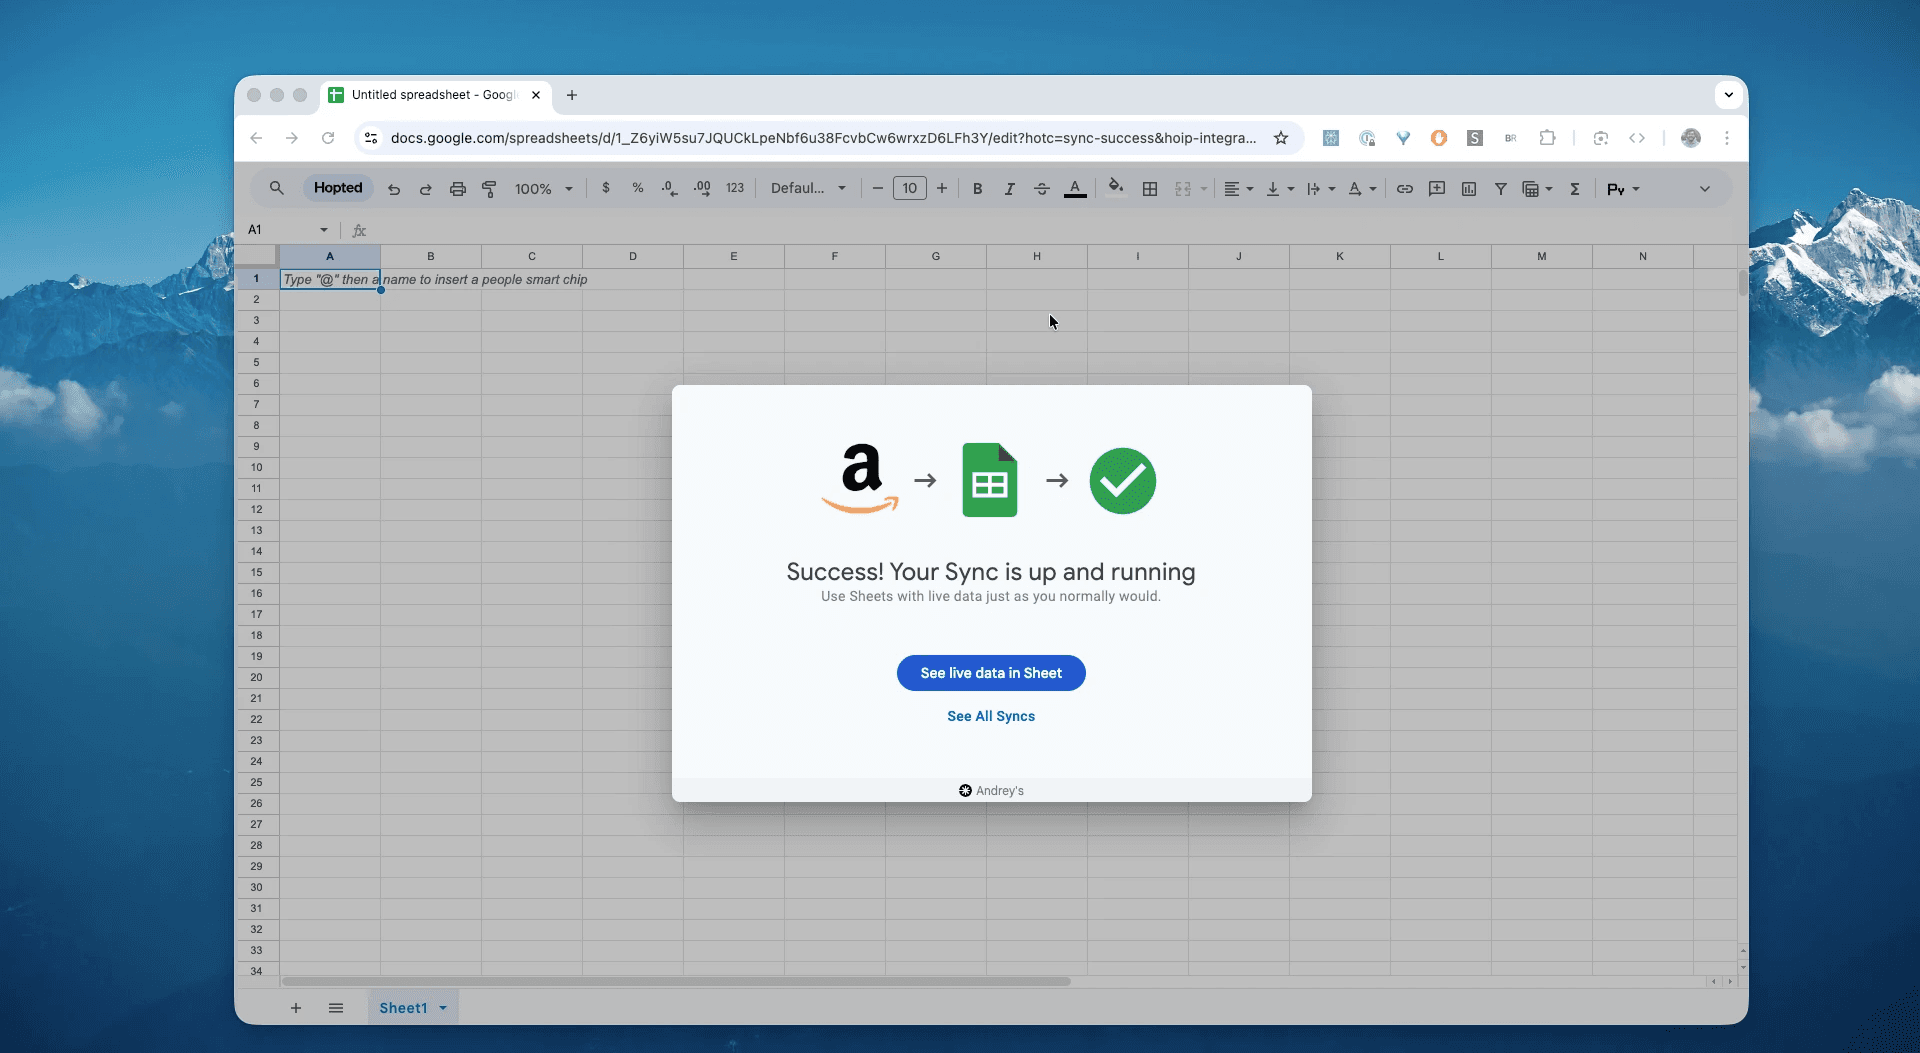
Using an Amazon to Google Sheets integration like Hopted, you set up the connection once, and your data flows automatically.
Step 1.
Install the Hopted browser extension and sign in using your Google Account.
Step 2.
Securely connect your Amazon Seller Central to Google Sheets using Hopted's integration wizard.
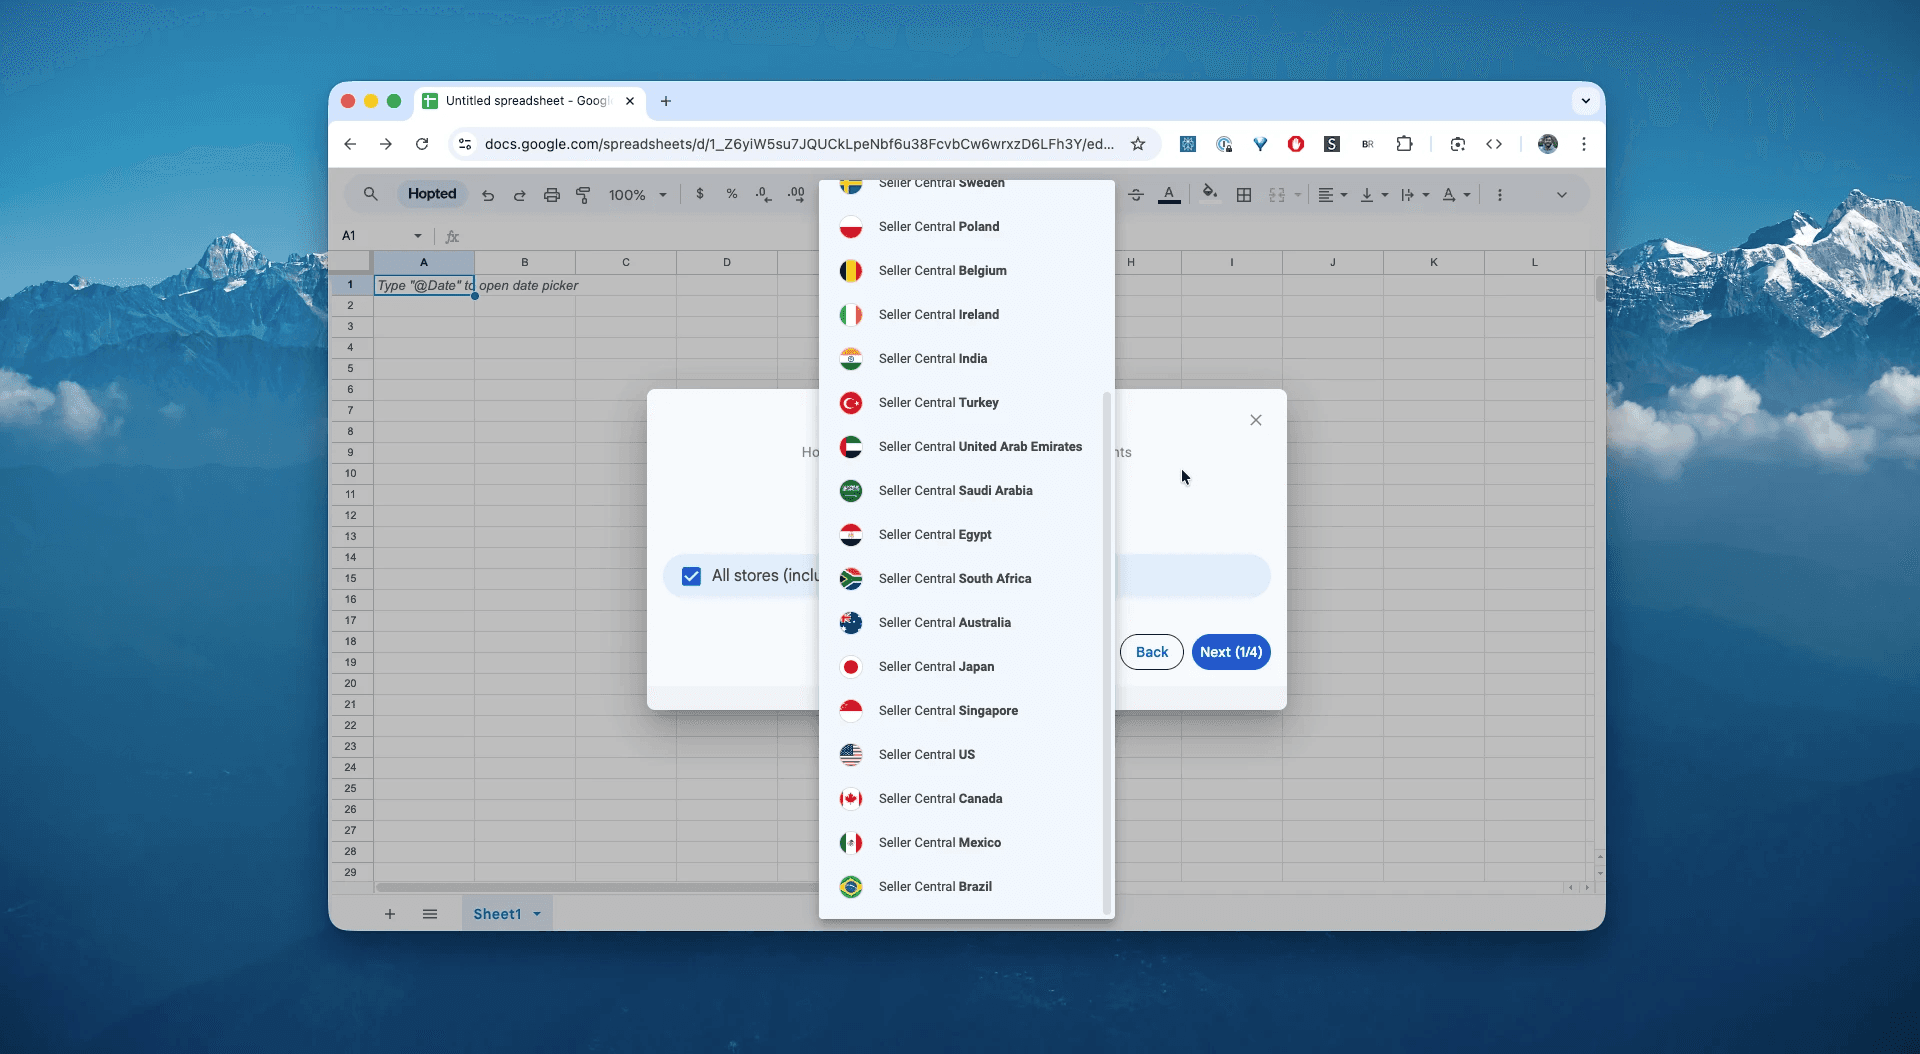
Step 3.
In Google Sheets, from the list of available Amazon Seller Central reports, select "FBA Restock Inventory".
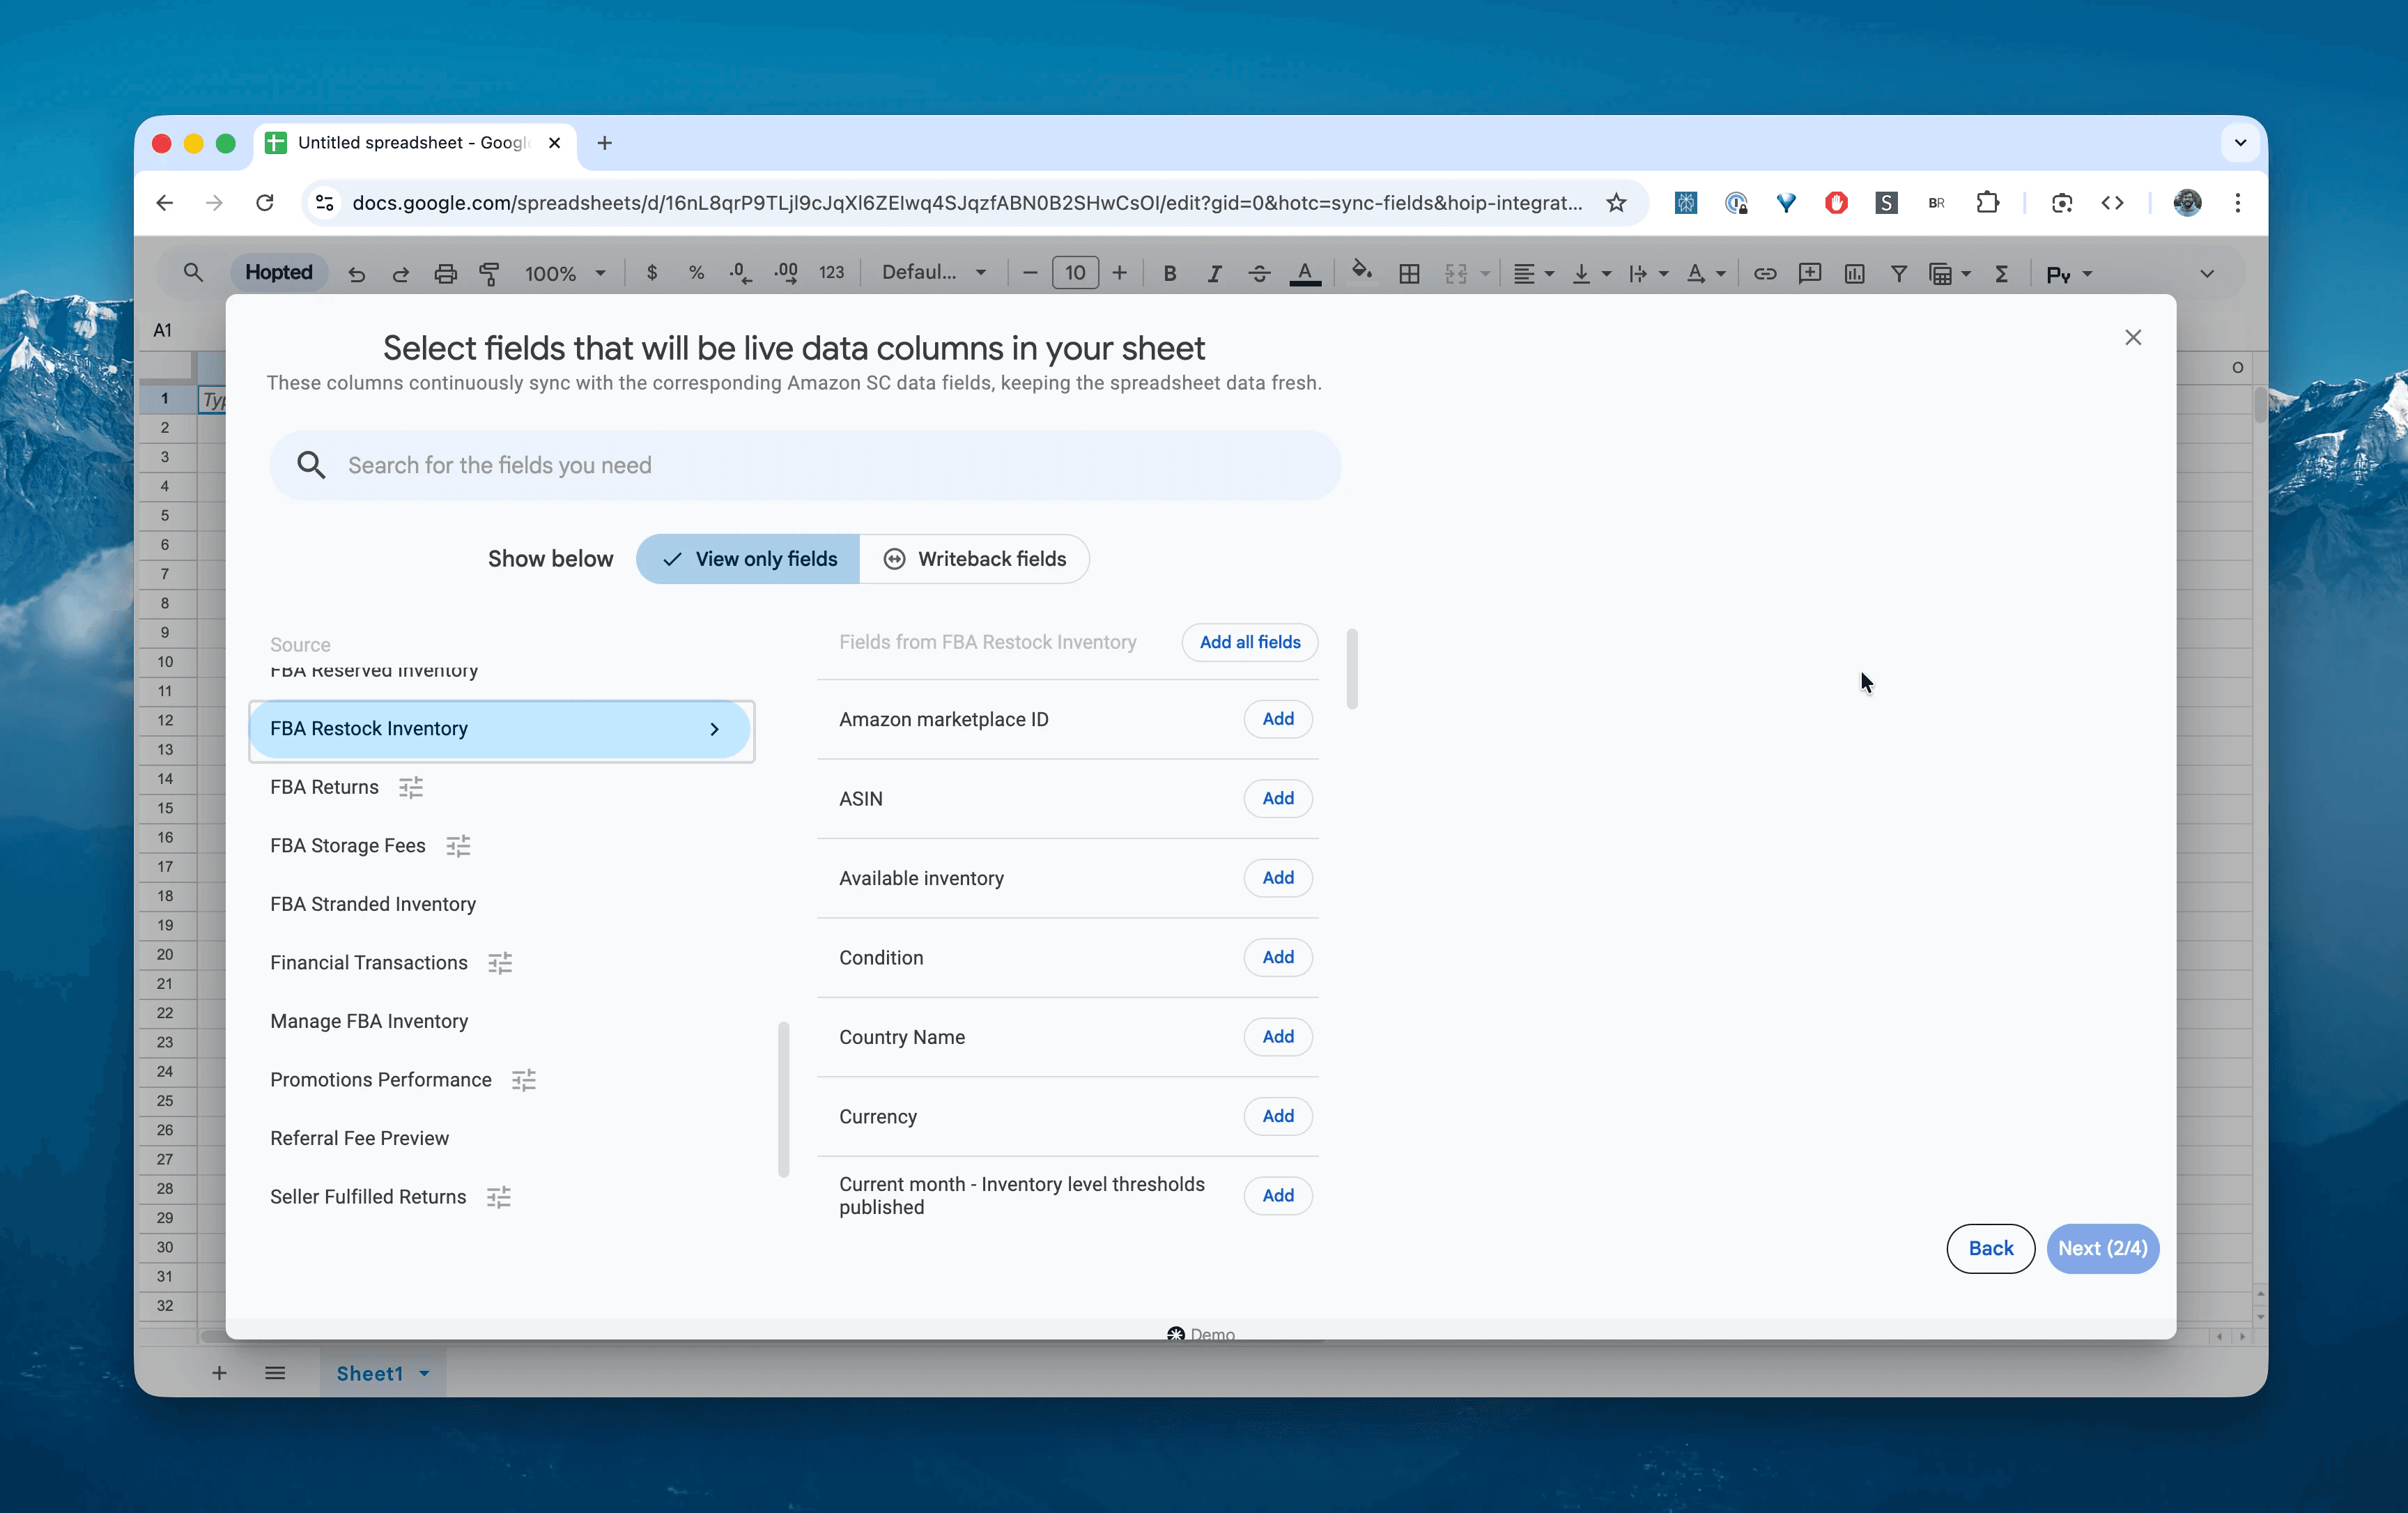
Step 4.
Select the critical columns for planning: Product Name, FNSKU, Days of Supply, Recommended replenishment qty, Recommended ship date, Instock risk, and Sales (last 30 days).
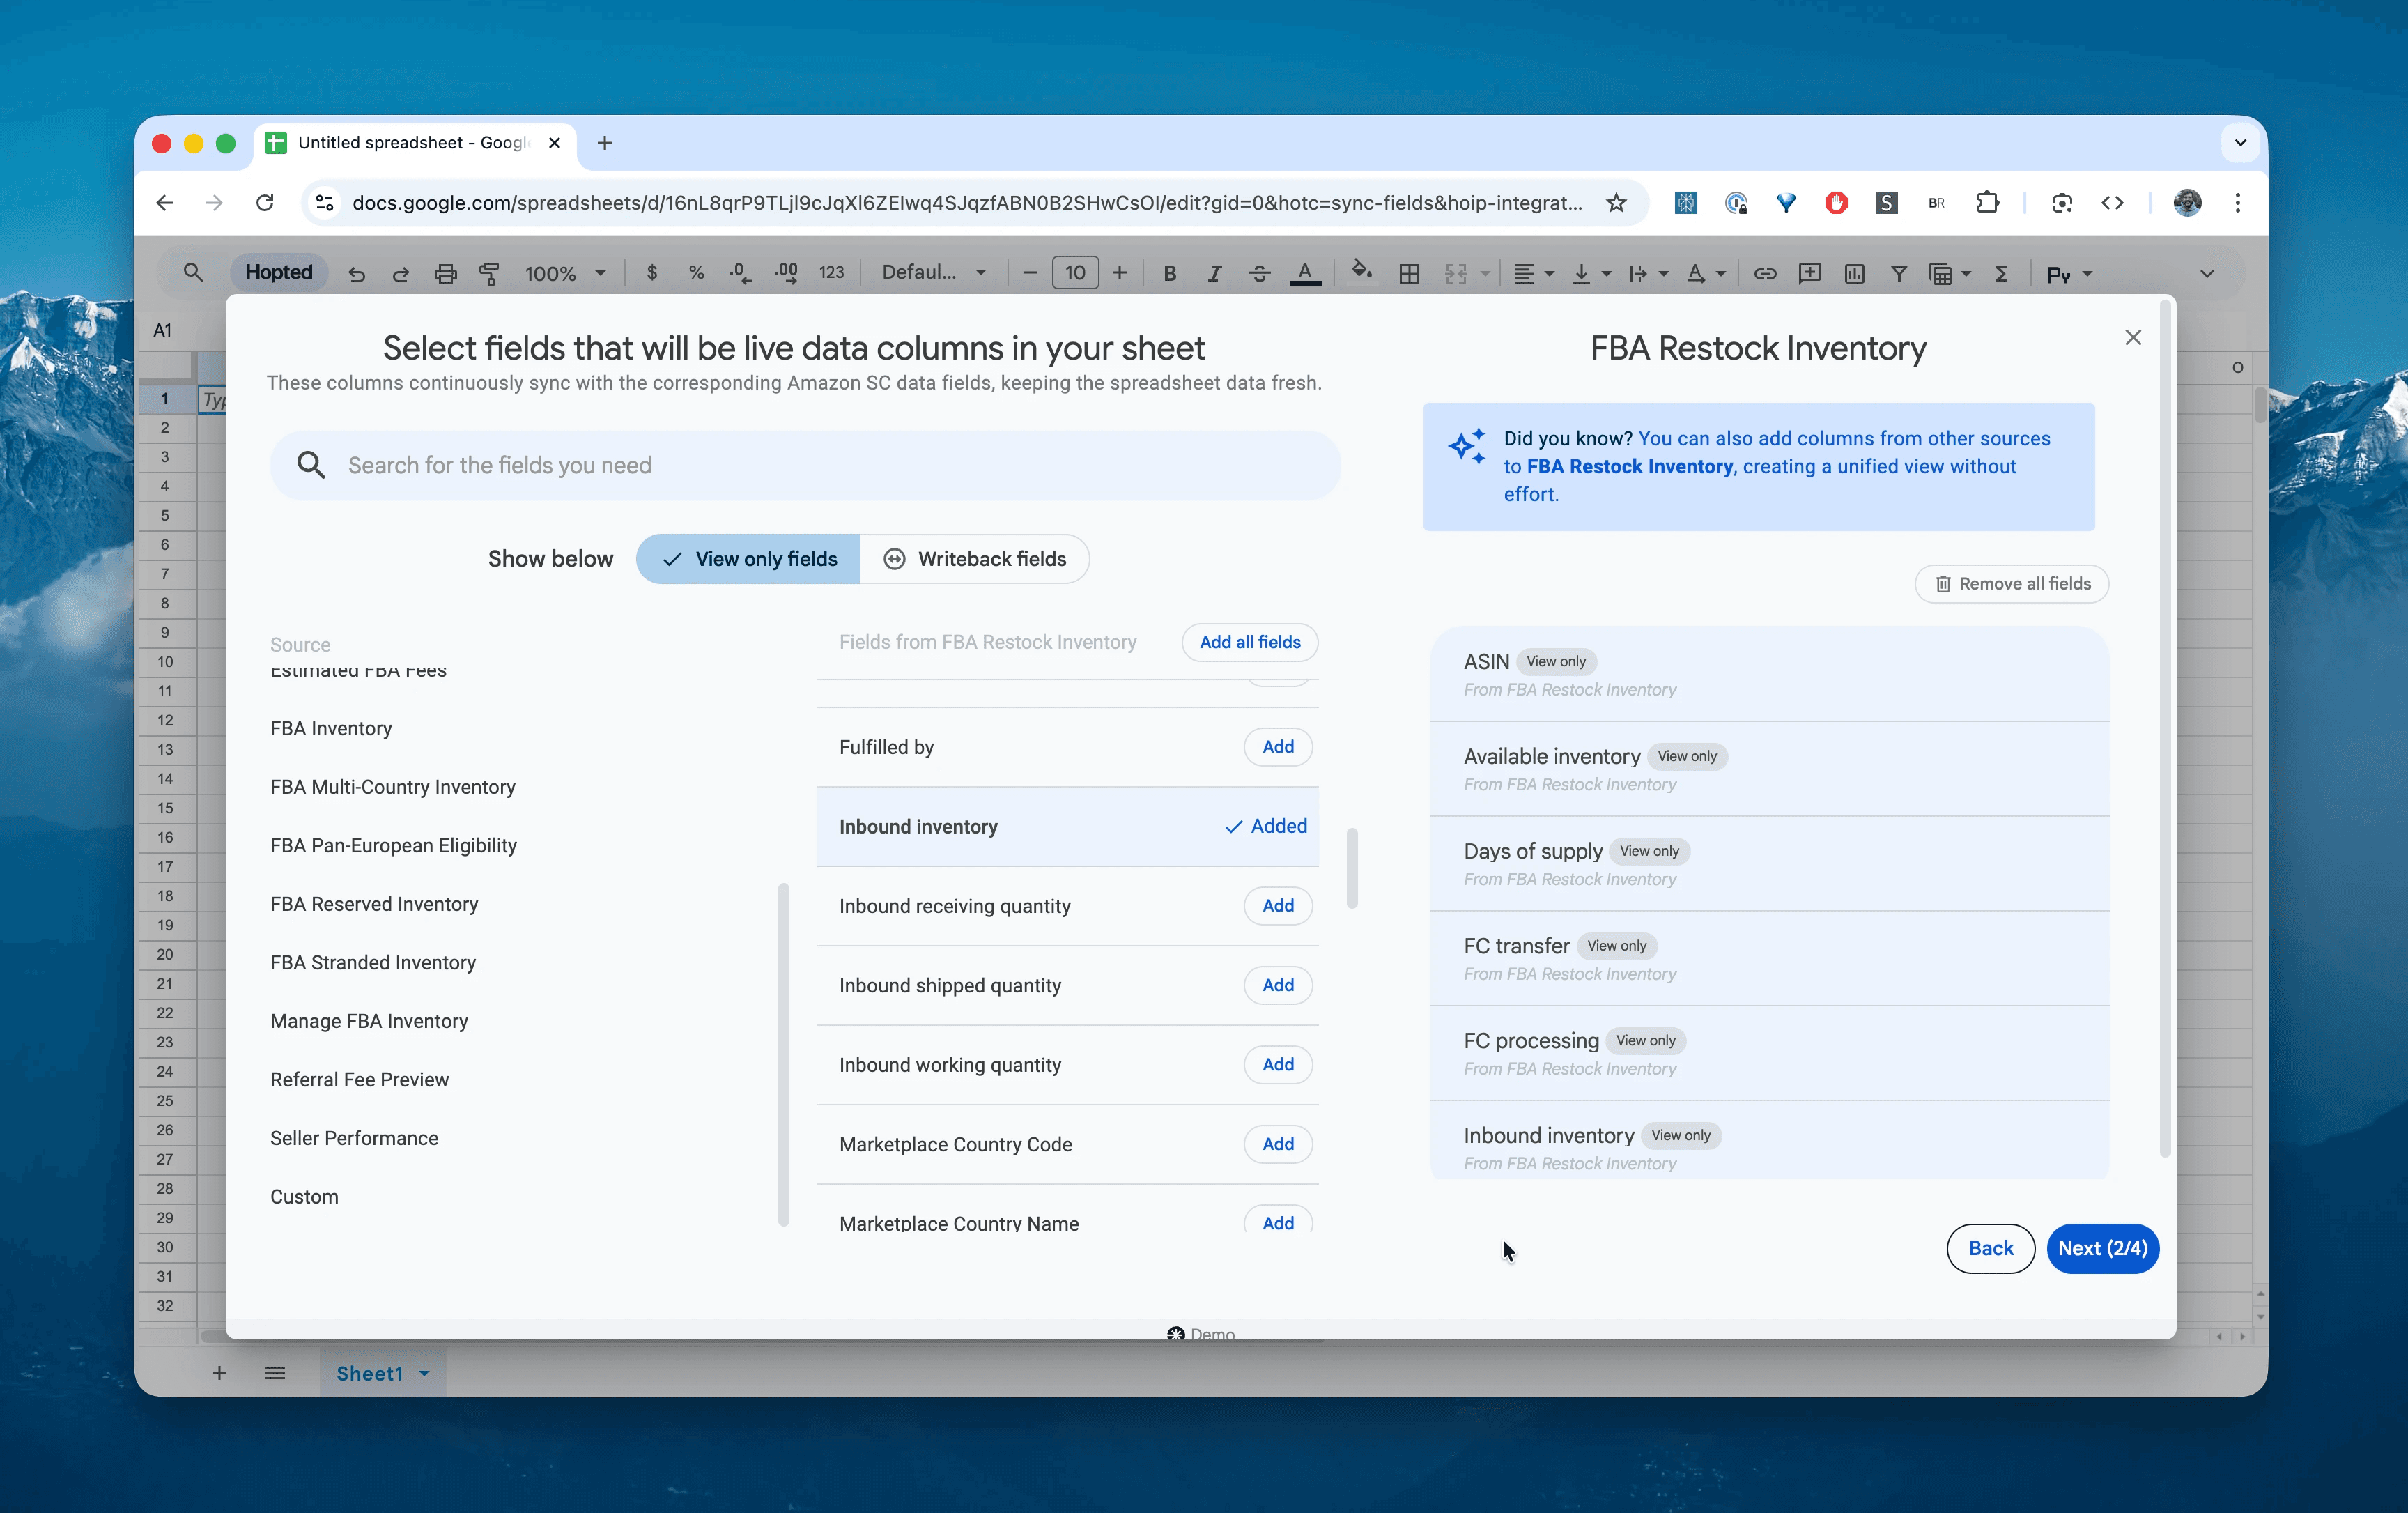
Step 5.
Set your schedule. Choose how often you want to export and refresh your restocking recommendations. We recommend a Daily schedule. A sudden spike in sales today changes your "Days of Supply" instantly, potentially moving your ship date from "Next Week" to "Immediately."
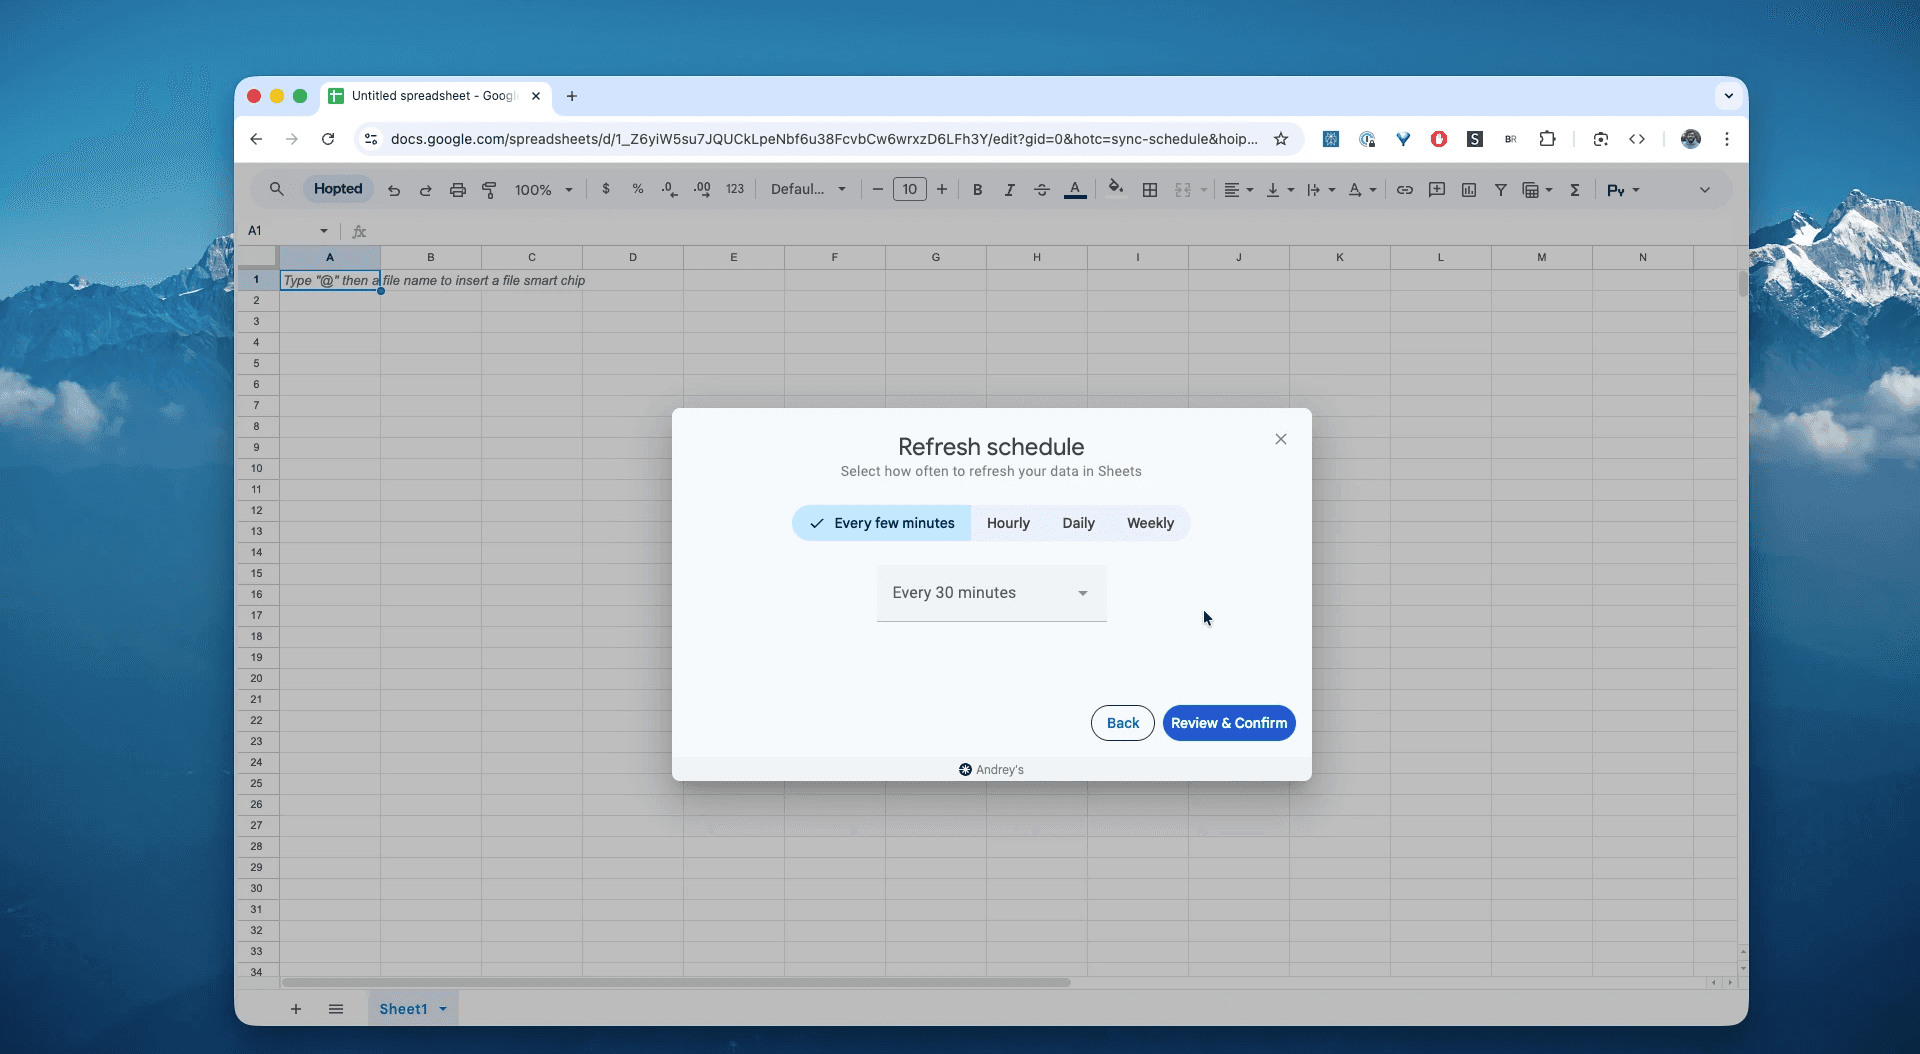
Step 6.
Save your data pipeline. This will export your forecasting data from Seller Central into spreadsheets instead of dealing with CSVs. Your purchasing plan will be up to date forever.
What is the Amazon FBA Restock Inventory Report?
This report is Amazon's "Crystal Ball." Unlike the Manage Inventory report (which tells you what you have), the Restock Report uses your sales history and lead time settings to tell you what you need.
It generates recommendations based on the variables you set in Seller Central (Supplier Lead Time, Restock Frequency) and the variables Amazon measures (Sales Velocity, Seasonality).
It is the primary tool for avoiding the "Red Zone" of stockouts.
This makes it the single source of truth for answering questions like:
Which 5 products are in danger of running out of stock in the next 14 days?Amazon says I have 60 "Days of Supply"—is that enough to cover the upcoming Chinese New Year blackout?What is the exact quantity I need to order from my supplier today to stay in stock?Why is Amazon recommending I restock a slow-moving item? (Identifying algorithmic errors).
How to Analyze & Track Your Restock Needs in Spreadsheets
Now that you have a live feed, you can move from data entry to data analysis. This is the real power of analyzing your Amazon Seller Central data in spreadsheets and building your Amazon excel-like template.
Here are 3 Amazon spreadsheet template ideas you can build immediately:
Template 1: The "Stockout Emergency" List
Amazon's definition of "Low Stock" might be different from yours. Build your own alert system.
Formula: Check
Days of Supply.Conditional Formatting:
Red: If
Days of Supply< 15 (Critical Emergency).Yellow: If
Days of Supply< 30 (Order Now).
What it shows you: An instant, color-coded view of your supply chain health. If you see Red, you are likely too late to ocean freight—you need to air freight stock immediately.
Template 2: The "Algorithm Audit" (Man vs. Machine)
Amazon's algorithm tends to be aggressive, often recommending you send too much stock (which earns them storage fees).
Ingredients:
Recommended replenishment qty(Amazon's Number).Sales (last 30 days)(Your Reality).
The Check: Create a column called "Reality Check."
Logic: If
Recommended qty> (Sales (last 30 days)* 3), highlight in Orange.What it shows you: Products where Amazon is asking you to send 3+ months of stock. This is dangerous for your IPI score and storage limits. Use your spreadsheet to override Amazon's suggestion and send a smaller, safer amount.
Template 3: The "Cash Flow" Forecaster
our CFO needs to know how much money to set aside for inventory.
Formula:
Recommended replenishment qty*[Your Unit Cost].Pivot Table: Group by
Recommended ship date(Month/Week).What it shows you: "We need $15,000 for inventory purchases next week, and $40,000 the week after." This turns supply chain data into financial planning data.
Common workflows this report unlocks
3PL Management: Share the
Recommended replenishment qtywith your 3PL so they can prep the labor required to label and ship your goods next week.Seasonality Adjustment: In spreadsheets, you can add a "Seasonality Multiplier" column (e.g., x1.5 for Q4) to Amazon's data to create a more accurate forecast than Amazon's basic linear model.
Discontinuation Filtering: Amazon will keep recommending restocks for products you want to kill. In Sheets, you can map your "Discontinued List" to this report and filter out those noisy recommendations.
FAQ about FBA Restock Inventory Report
Q: How does Amazon calculate "Days of Supply"? It is calculated as: Current Inventory / Forecasted Daily Sales. Note: Current inventory includes Available + Inbound. Forecasted sales are based on your recent history and seasonality.
Q: Why is the "Recommended Ship Date" in the past? If the date is in the past (e.g., "3 days ago"), it means you are already late. Based on your lead time settings, you will likely run out of stock before the new shipment arrives. You need to expedite shipping immediately.
Q: Can I customize the recommendations? Yes. In Seller Central, you can edit "Lead Time," "Packing Time," and "Restock Frequency" at the SKU level. Hopted pulls the recommendations based on these settings. If the report data looks wrong, check your lead time settings first.
Q: Does this report account for "inbound" inventory? Yes. Amazon considers inventory that is "Inbound Working," "Shipped," and "Receiving" as part of your supply. It will not recommend you order more if you already have a shipment on the way that covers the demand.
Q: How is Hopted different from other Amazon seller software? Most Amazon tools force you into their rigid dashboards and pre-built reports. You have to change your workflow to fit their software. With Hopted it is the opposite. It’s a flexible data automation layer that works directly inside your existing spreadsheets (like Google Sheets). Instead of forcing you to learn a new system, Hopted brings all your scattered Amazon data (sales, inventory, forecasts) right to you. You can build the fully custom forecasting models you need, not the ones a rigid tool dictates.


Hopted,
explained.
Watch the film