FBA seller face the "phantom inventory" problem: lost units, unexplained damages, and warehouse discrepancies that cost you thousands. We'll cover how to automatically pull your FBA Inventory Ledger report directly into Google Sheets so you can finally track, analyze, and reconcile every unit and claim the reimbursements you are owed.

How to Automatically Sync & Import the FBA Inventory Ledger Detailed Report to Google Sheets (The Hopted Way)
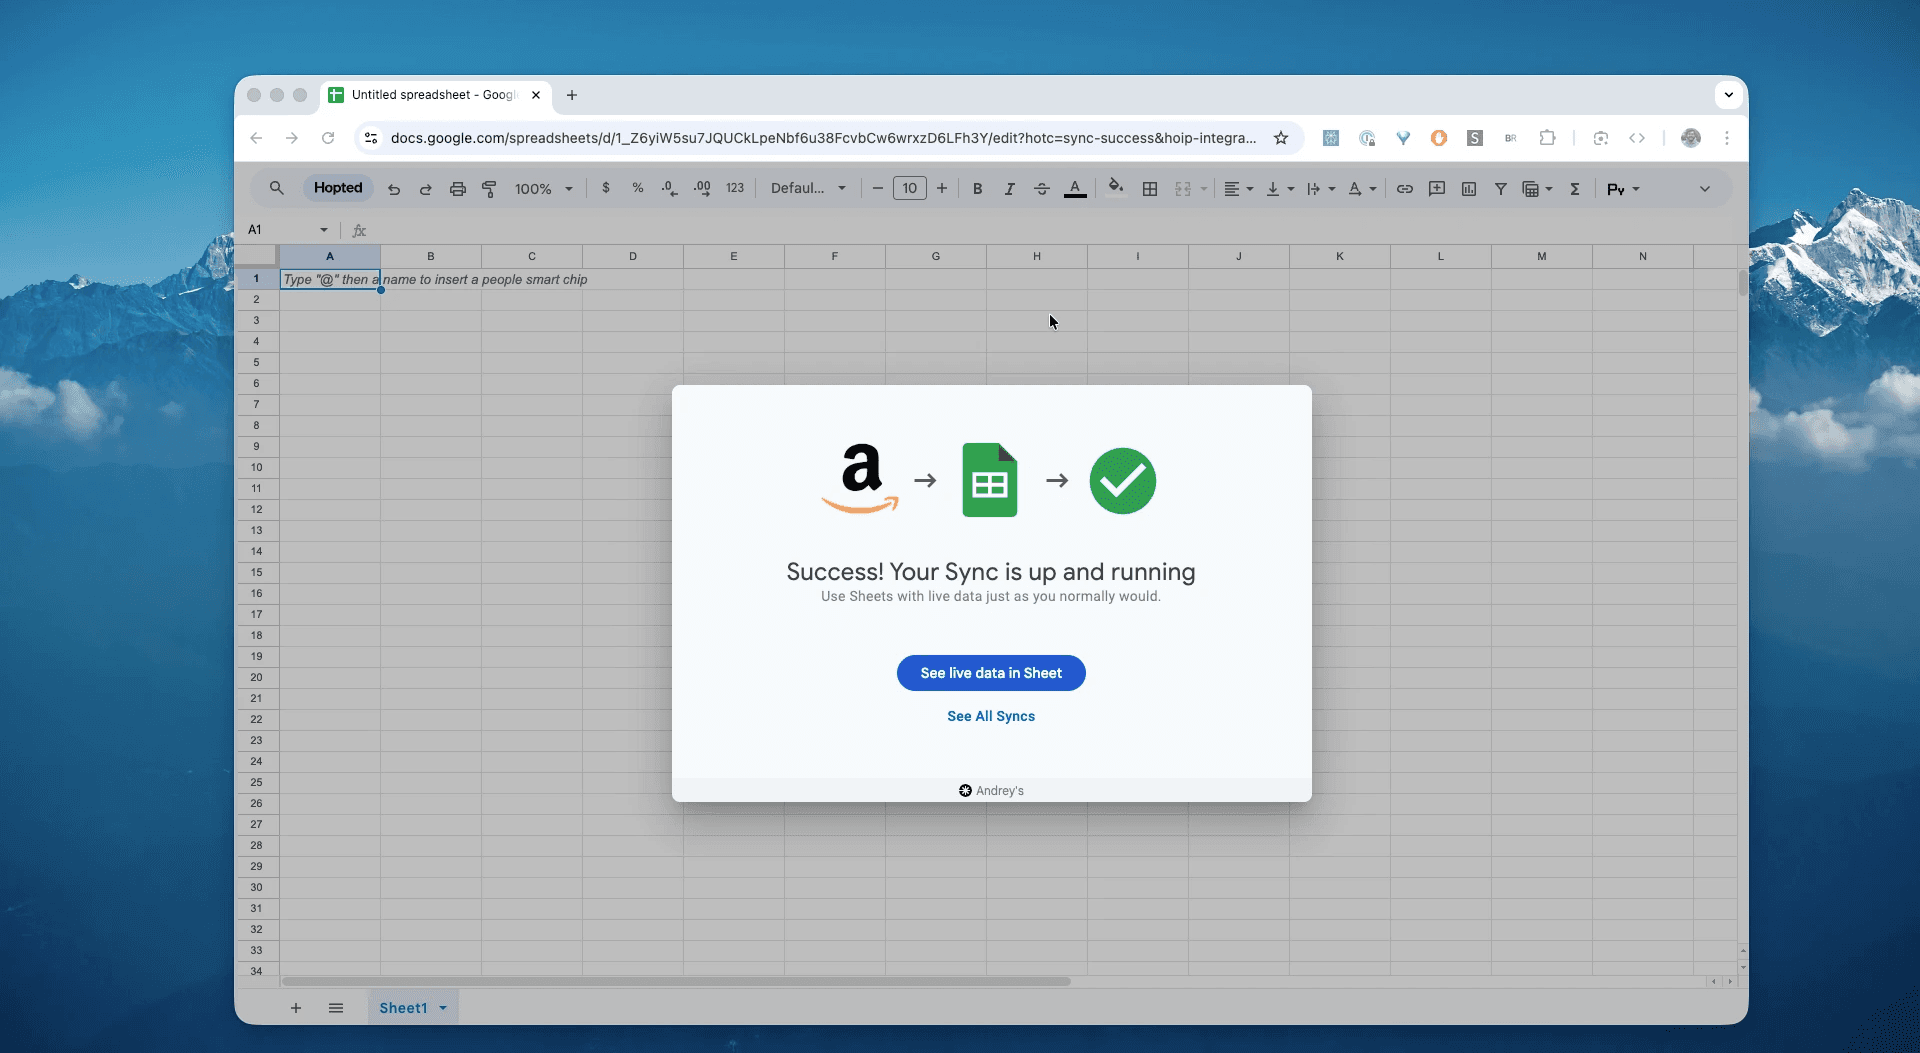
Using an Amazon to Google Sheets integration like Hopted, you set up the connection once, and your data flows automatically.
Step 1.
Install the Hopted browser extension and sign in using your Google Account.
Step 2.
Securely connect your Amazon Seller Central to Google Sheets using Hopted's integration wizard.
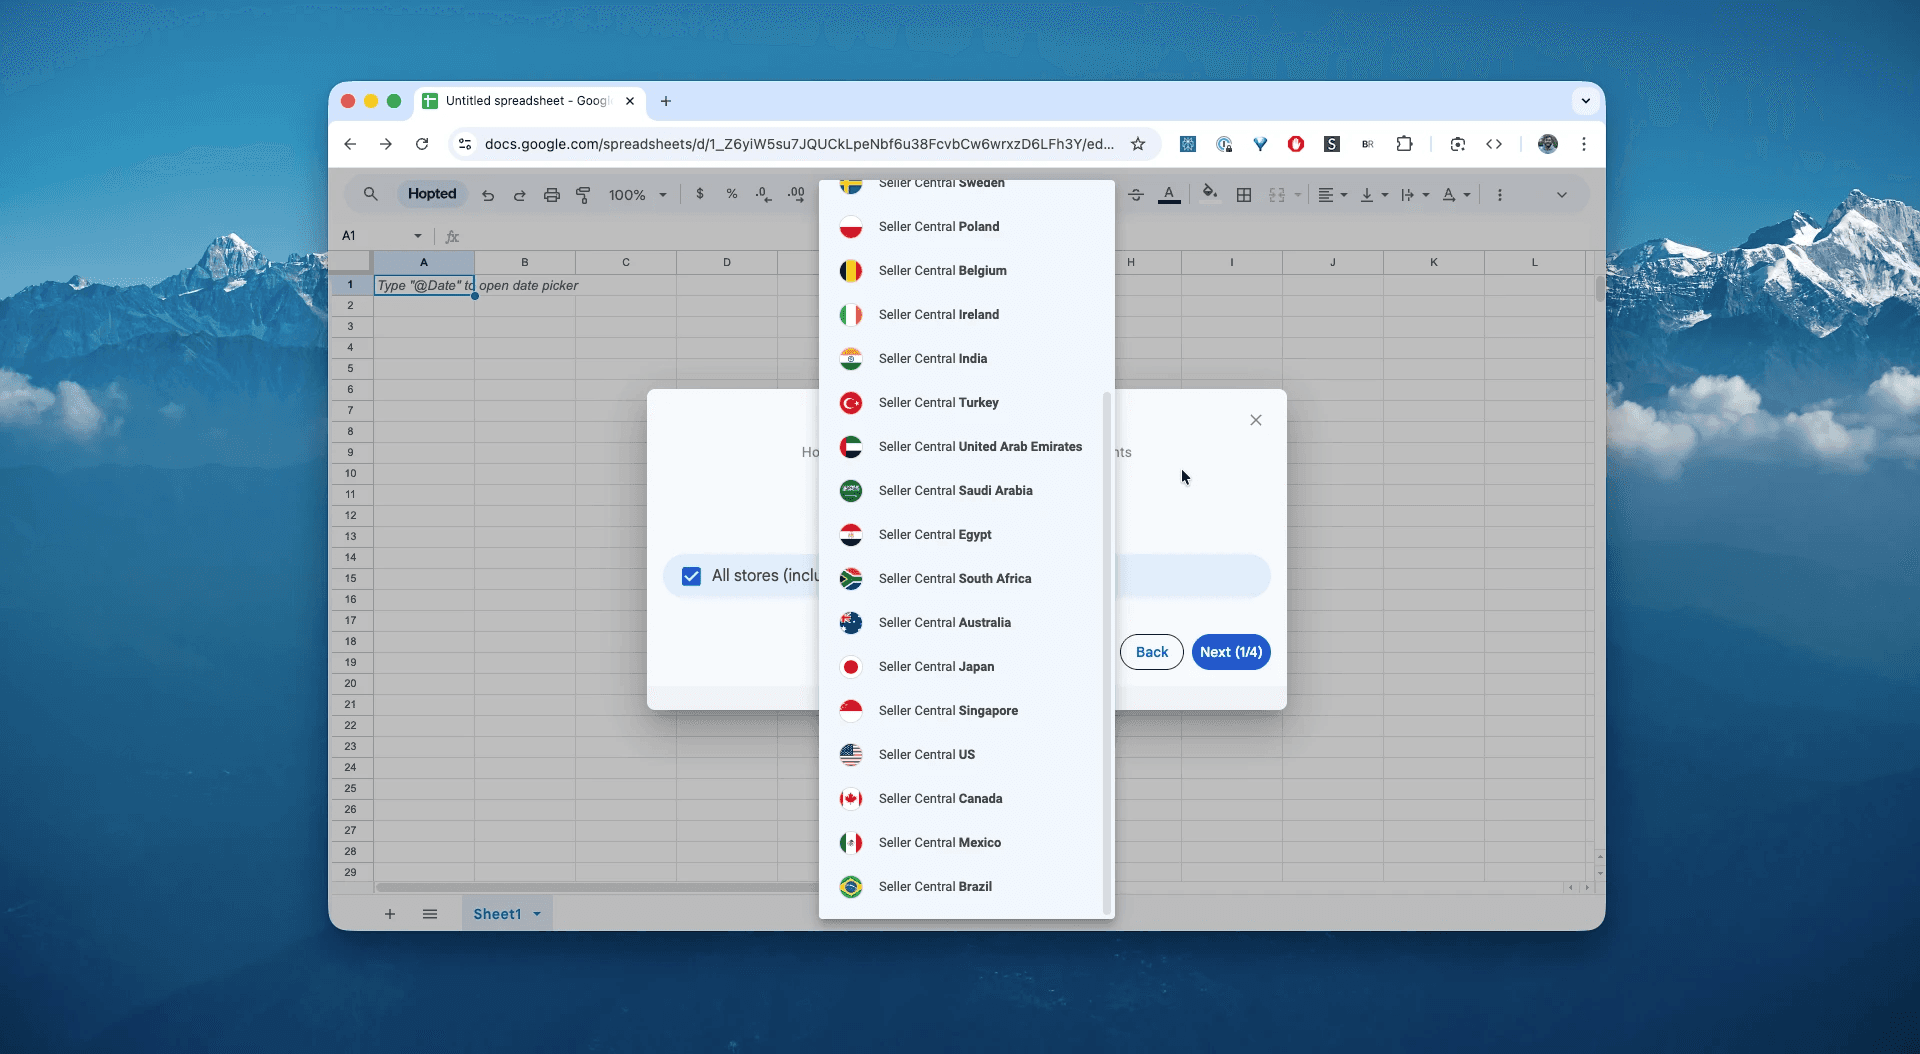
Step 3.
In Google Sheets, from the list of available Amazon Seller Central reports, select "FBA Inventory Ledger (Detailed)" for a specific date range. This can be as recent as the "Last 24 hours" or a custom range going as far back as 35 months. For this example, we'll select "Include records for the last 7 days".
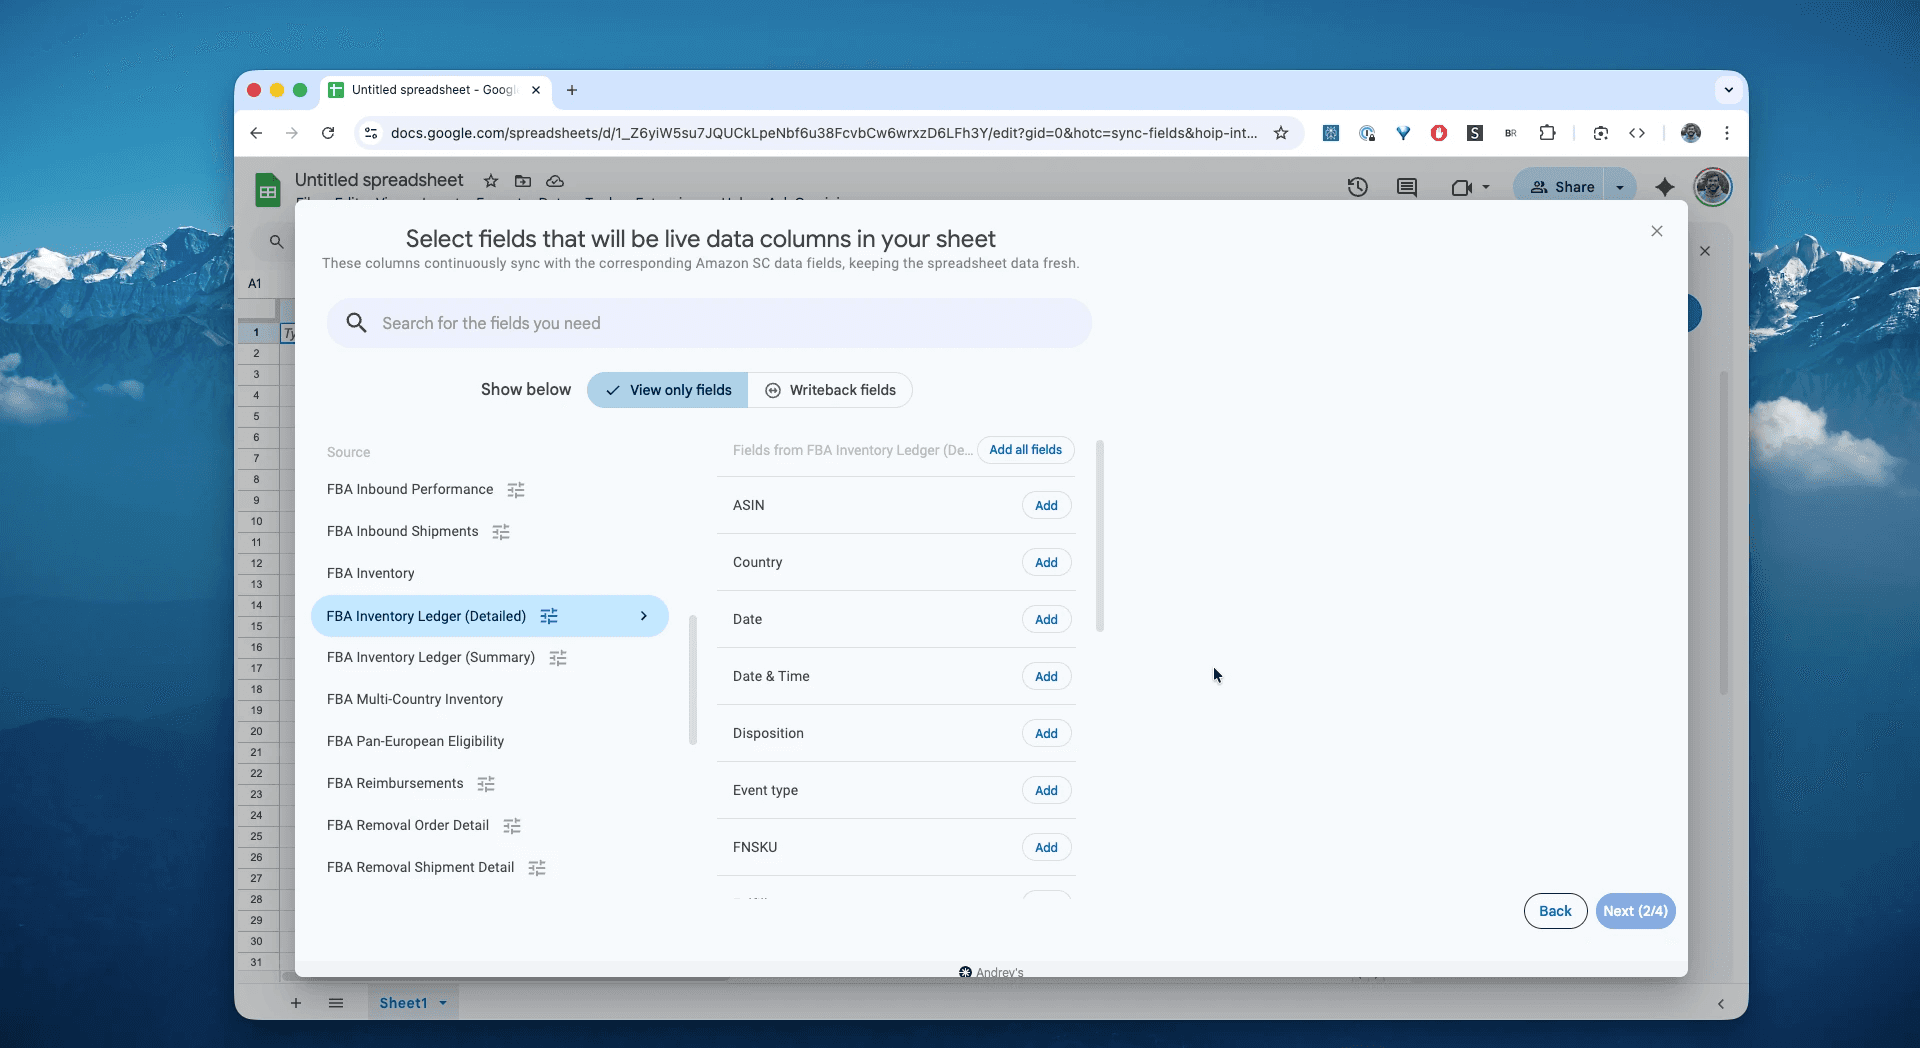
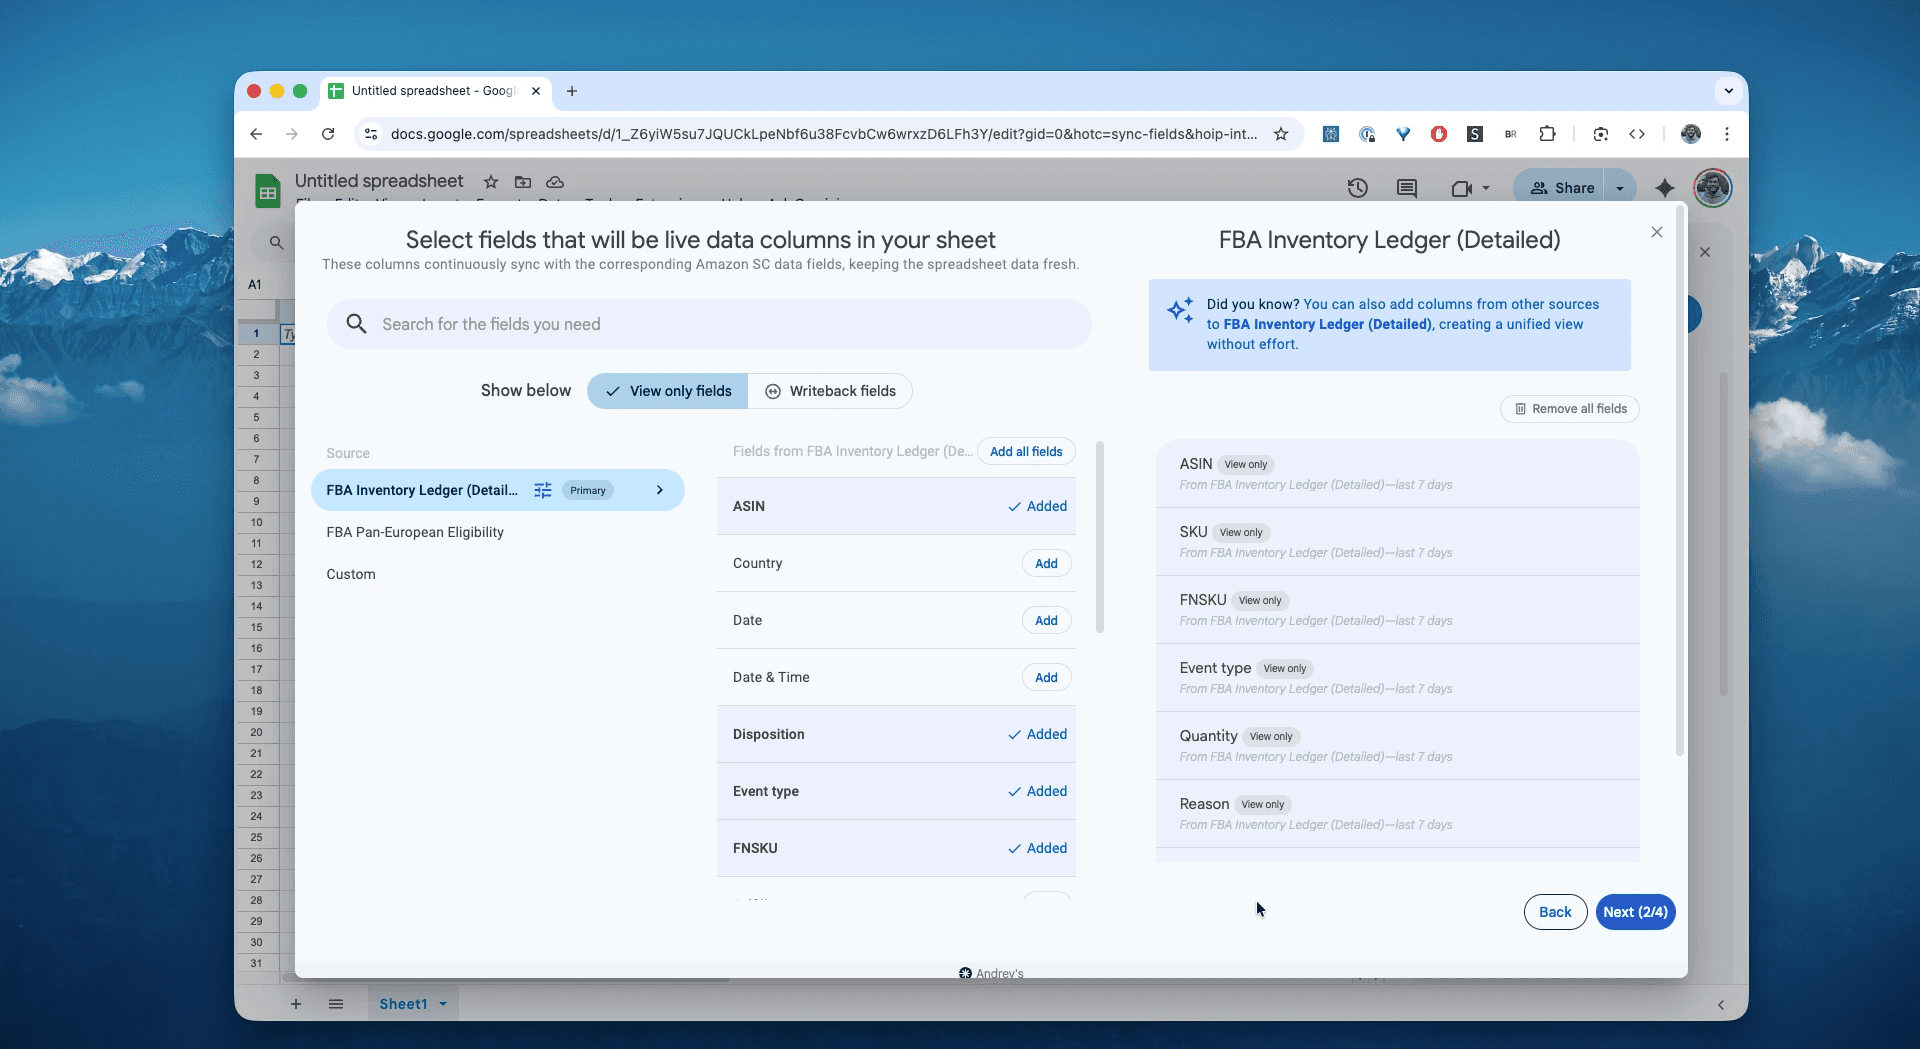
Step 4.
Select columns that you need: ASIN, SKU, FNSKU, Event type, quantity, reference ID, Disposition, Reason, and other fields.
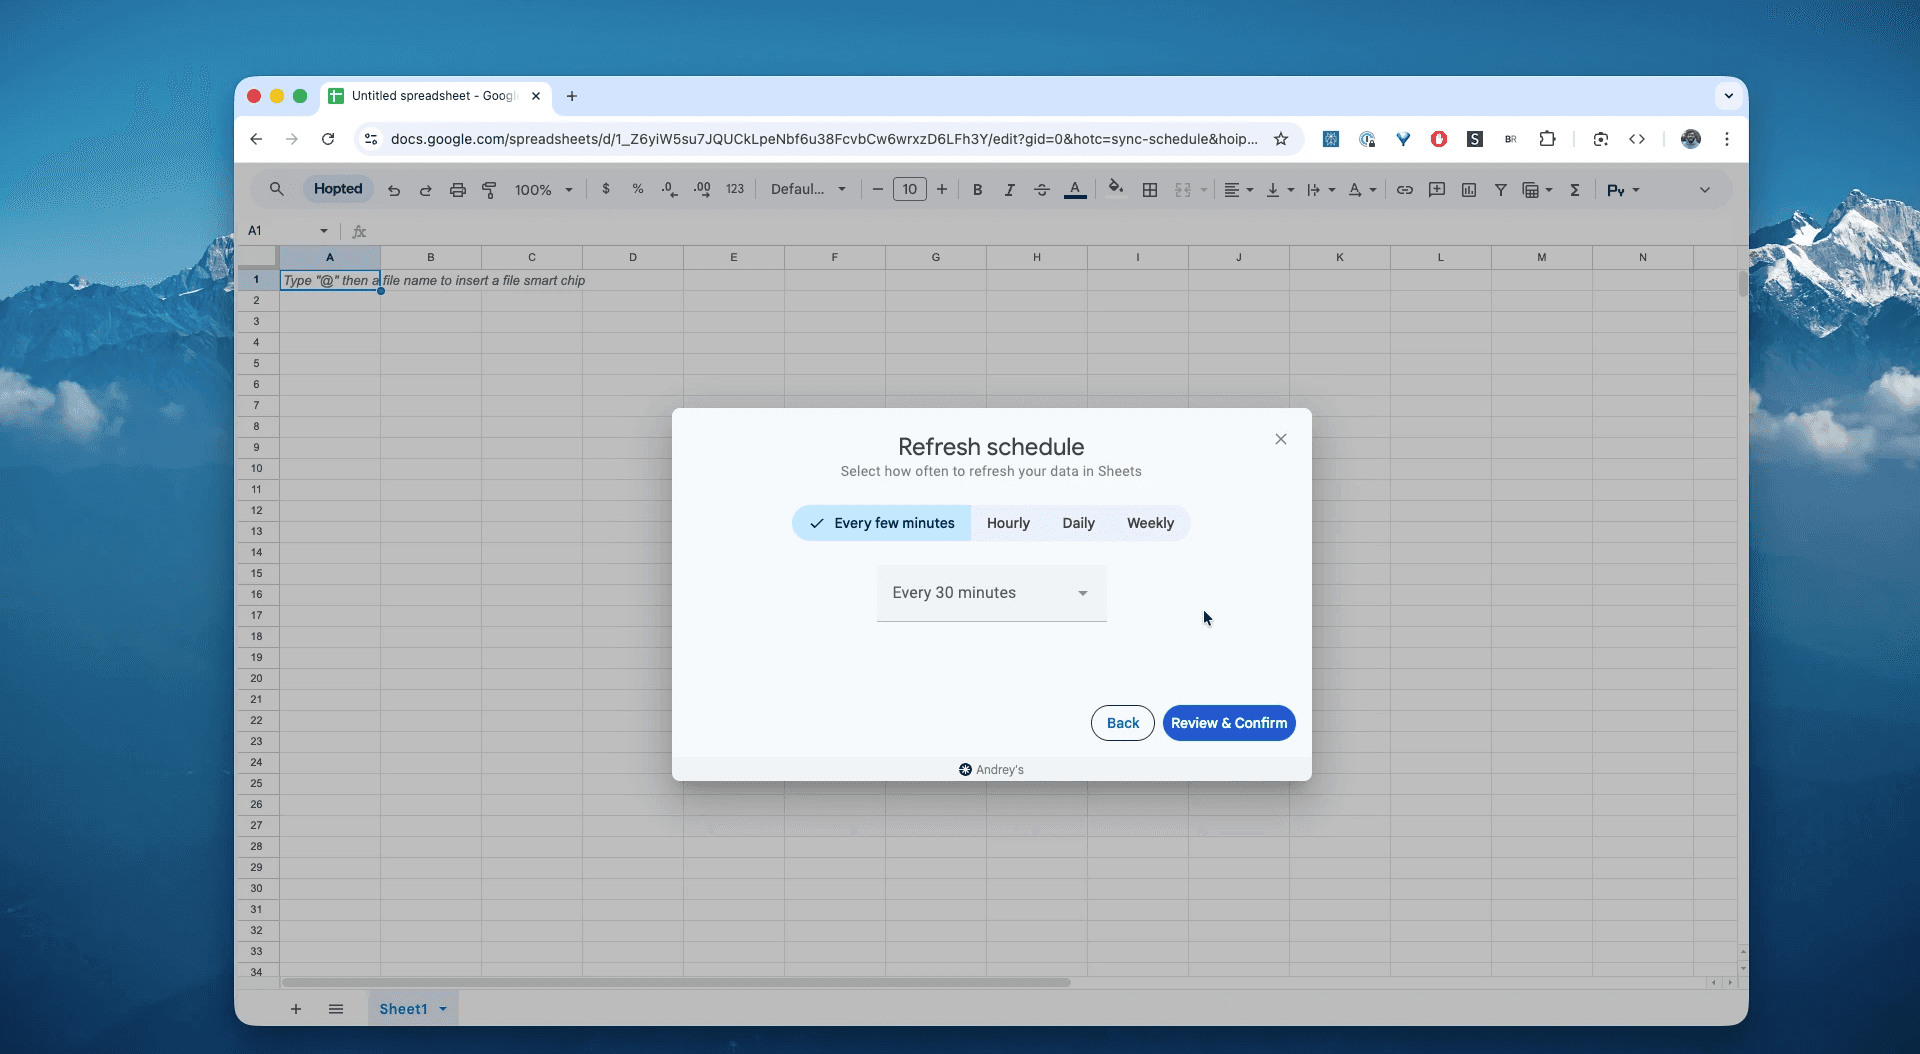
Step 5.
Set your schedule. Choose how often you want to export and refresh your FBA inventory ledger (detailed view)—every hour, every day, or less frequent.
Step 6.
Save your data pipeline. This will export your FBA inventory events from Seller Central into spreadsheets instead of dealing with CSVs. The detailed view in your spreadsheets will be up to data forever.
What is the Amazon FBA Inventory Ledger (Detailed) Report?
This is the most granular and important inventory report in Seller Central. While other reports show you a snapshot of your inventory, the Inventory Ledger shows you the history. It is the official transaction log for every ASIN in Amazon's fulfillment network. You must use the Detailed view for true reconciliation and finding specific errors.
Bank-statement analogy: End-to-end reconciliation in one place: starting balances, inflows, outflows, and ending position (with Disposition/FC context).
This makes it the single source of truth for answering questions like:
Which fulfillment center damaged my products?Where did those 5 units I shipped last Tuesday actually go?How can I prove to Amazon they lost my inventory?Which event types (receipts, transfers, shipments, returns, adjustments) moved the most units this week?What Reference IDs explain a SKU’s stock drop on a specific date?Which FCs or markets drive the highest shrink %?Are receipts keeping pace with customer shipments for our top ASINs?What’s our sellable vs. unsellable disposition trend by FC?
How to Analyze & Track Your Inventory Ledger Events in Spreadsheets
Now that you have a live feed, you can move from data entry to data analysis. This is the real power of analyzing your Amazon Seller Central data in spreadsheets and building your Amazon excel-like template.
Here are 3 Amazon spreadsheet template ideas you can build immediately:
Template 1: The "Reimbursement Finder"
This is the #1 reason. By pulling all "Damaged" or "Lost" transaction types into one sheet, you create an instant to-do list for filing reimbursement claims.
Action: Filter the
Transaction Typecolumn to show only "Damaged" and "Lost" (e.g.,WH_DAMAGED,CUSTOMER_RETURN_DAMAGED,INV_LOST, etc.).What it shows you: This is your punch list. These are units Amazon has admitted to losing or damaging. You can now cross-reference this list with your Reimbursements report to see which ones you haven't been paid for yet.
Template 2: The "Fulfillment Center" Pivot Table
Find out which warehouses are costing you money.
How to build it: Create a Pivot Table.
Rows:
Fulfillment Center (FC)Columns:
Transaction TypeValues:
SUM of QuantityWhat it shows you: You'll instantly see if one FC (e.g., "DFW7") is responsible for 90% of your
WH_DAMAGEDtransactions. This is powerful evidence to use when contacting Amazon support.
Template 3: The "ASIN Discrepancy" Audit
This is the core of your Amazon inventory management spreadsheet.
How to build it: Another Pivot Table.
Rows:
ASINValues:
SUM of QuantityWhat it shows you: This gives you the net inventory position for each ASIN according to the ledger. You can now compare this total to your other inventory reports (like the FBA Inventory report). If the numbers don't match, you have a "phantom unit" discrepancy and can start digging into the transaction log for that specific ASIN to find out why.
Common workflows this report unlocks
Prove where units went: tie event type + reference id to orders, FC transfers, and adjustments to reconcile every unit.
Surface shrink/loss fast: filter Reason/Disposition for lost, found, FC-damaged to spot reimbursement opportunities.
Audit 3PL & prep QA: attribute problems to FC, country, or vendor and fix packaging/labeling SOPs.
Replace stitching multiple reports: get one consistent feed instead of juggling 6 different downloads.
FAQ about FBA Inventory Ledger (Detailed view)
Q: What is the difference between FBA Inventory Ledger Detailed View and Summary view?
The Summary view groups transactions by day and type (e.g., "100 units received on Monday"). The Detailed view (which this guide is about) shows every single transaction. You won't just see "100 units received"; you'll see 100 individual "Receipt" events, each with a specific timestamp and reference. Detailed = per-event rows (near real-time); Summary = aggregated daily/weekly/monthly balances. Use Detailed for reconciliations and claims.
Q: Where do I download the Amazon FBA Inventory Ledger (Detailed) report?
If you want to extract it manually in Seller Central: Reports → Fulfillment → Inventory Ledger, then choose Detailed and your filters; export as TSV/CSV. Our recommended way is pulling this report automatically based on the schedule.
Q: How do I analyze FBA inventory transfers between fulfillment centers?
Filter Event Type for transfers; group by Fulfillment Center and Country to see FC→FC flows and impacts.
Q: What’s the best KPI to monitor shrink in the Detailed report?
Shrink % = (Lost + Damaged) / Receipts, trended weekly by FC and ASIN to catch anomalies early.
Q: Can I connect the Amazon Inventory Ledger to Excel?
While many sellers look for an Excel plugin for Amazon Seller Central, this report is often too large for Excel to handle effectively, leading to crashes. A more robust solution is to pull the Amazon report into Google Sheets using an integrator like Hopted, which handles the large data volume in the cloud and appends new data automatically. See the guide above.
Q: How do I automate my FBA inventory reconciliation process?
The easiest way is with an Amazon to Google Sheets integration. A tool like Hopted can sync your Amazon seller metrics (like the Inventory Ledger) on a daily schedule. This builds a master database of all transactions, extracts Seller Central data, allowing you to use pivot tables and formulas to automatically compare Amazon's numbers to your own shipping records without any manual data entry.
Q: How is Hopted different from other Amazon seller software?
Most Amazon tools force you into their rigid dashboards and pre-built reports. You have to change your workflow to fit their software. With Hopted is the opposite. It’s a flexible data automation layer that works directly inside your existing spreadsheets (like Google Sheets). Instead of forcing you to learn a new system, Hopted brings all your scattered Amazon data (sales, inventory, orders, etc.) right to you. You can build the fully custom reports and automations you need, not the ones a rigid tool dictates.


Hopted,
explained.
Watch the film