As an FBA seller, you know that inbound shipment errors are costly. A missing label, an unexpected item, or a damaged product can lead to receiving delays, penalty fees, and even suspension of your shipping privileges. We'll cover how to automatically pull your Inbound Performance report directly into Google Sheets so you can track defects, identify problem ASINs, and hold suppliers accountable—all in one place.

How to Automatically Sync & Import your FBA Inbound Performance Report to Google Sheets (The Hopted Way)
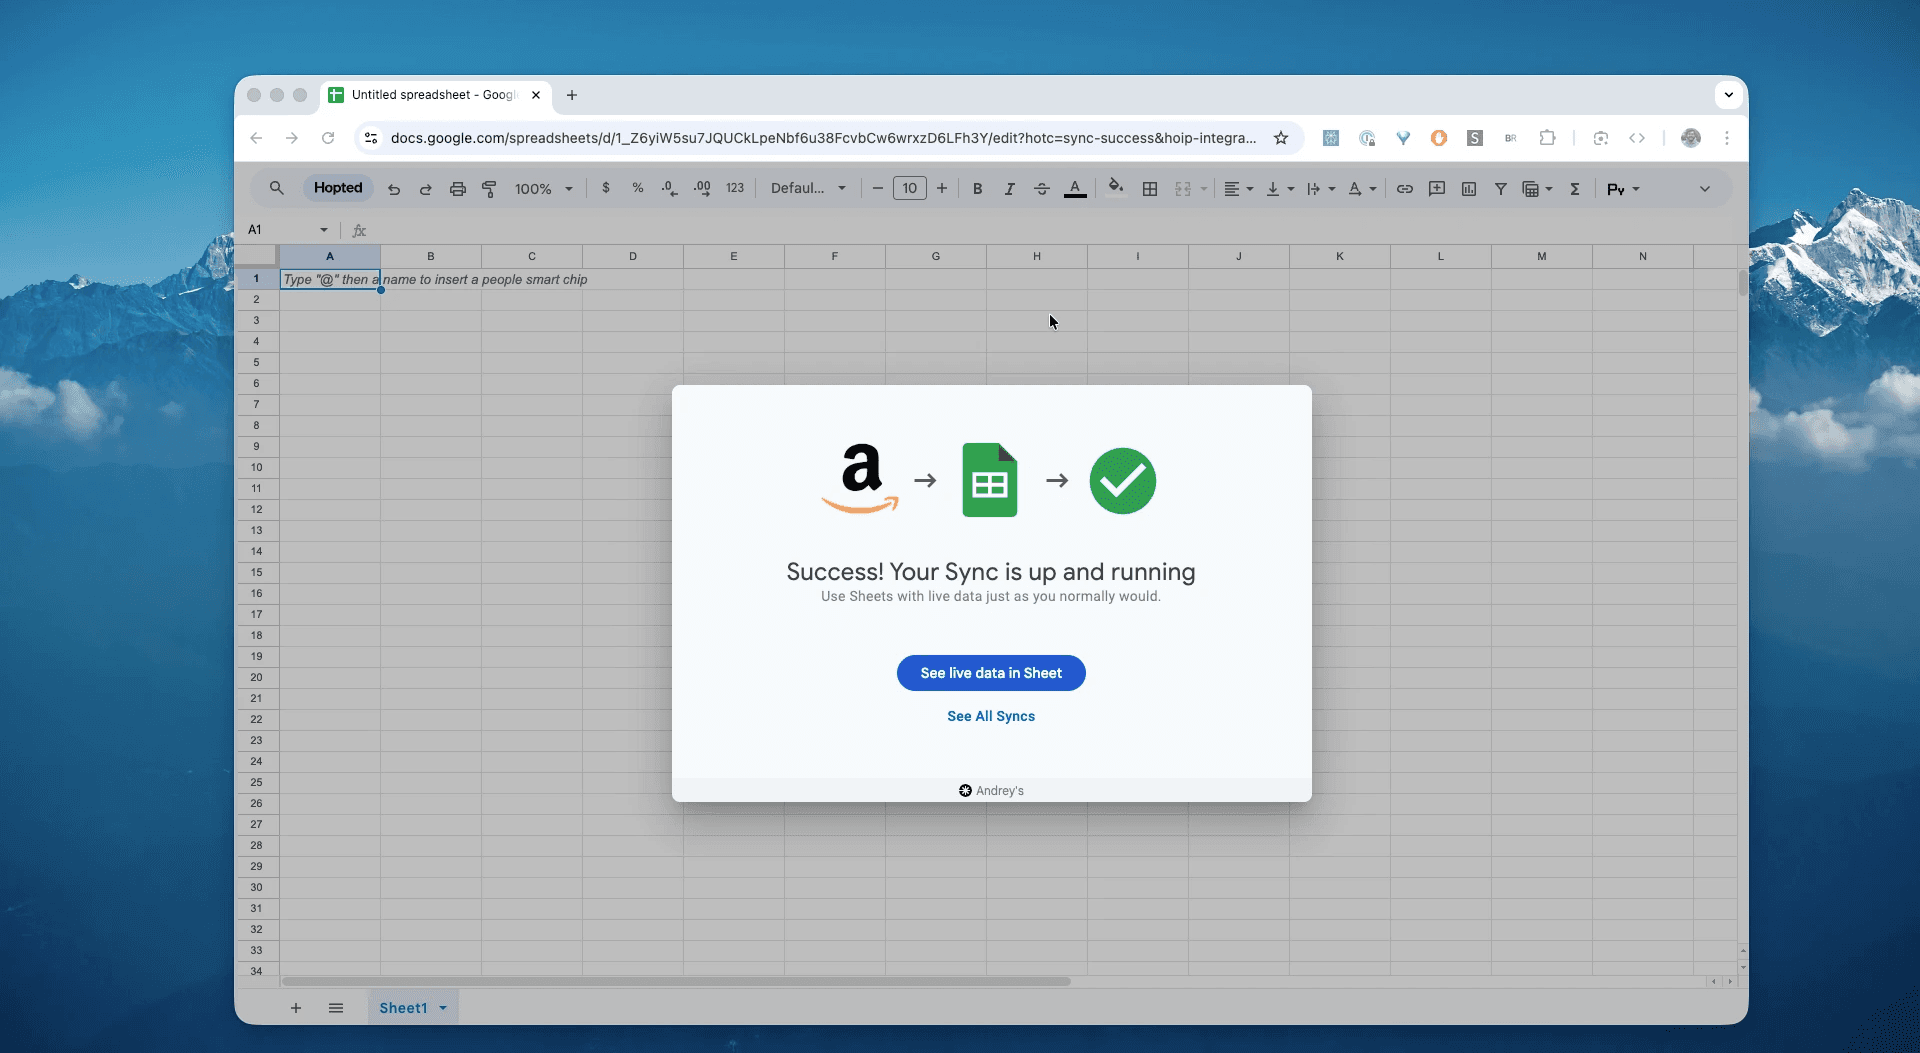
Using an Amazon to Google Sheets integration like Hopted, you set up the connection once, and your data flows automatically.
Step 1.
Install the Hopted browser extension and sign in using your Google Account.
Step 2.
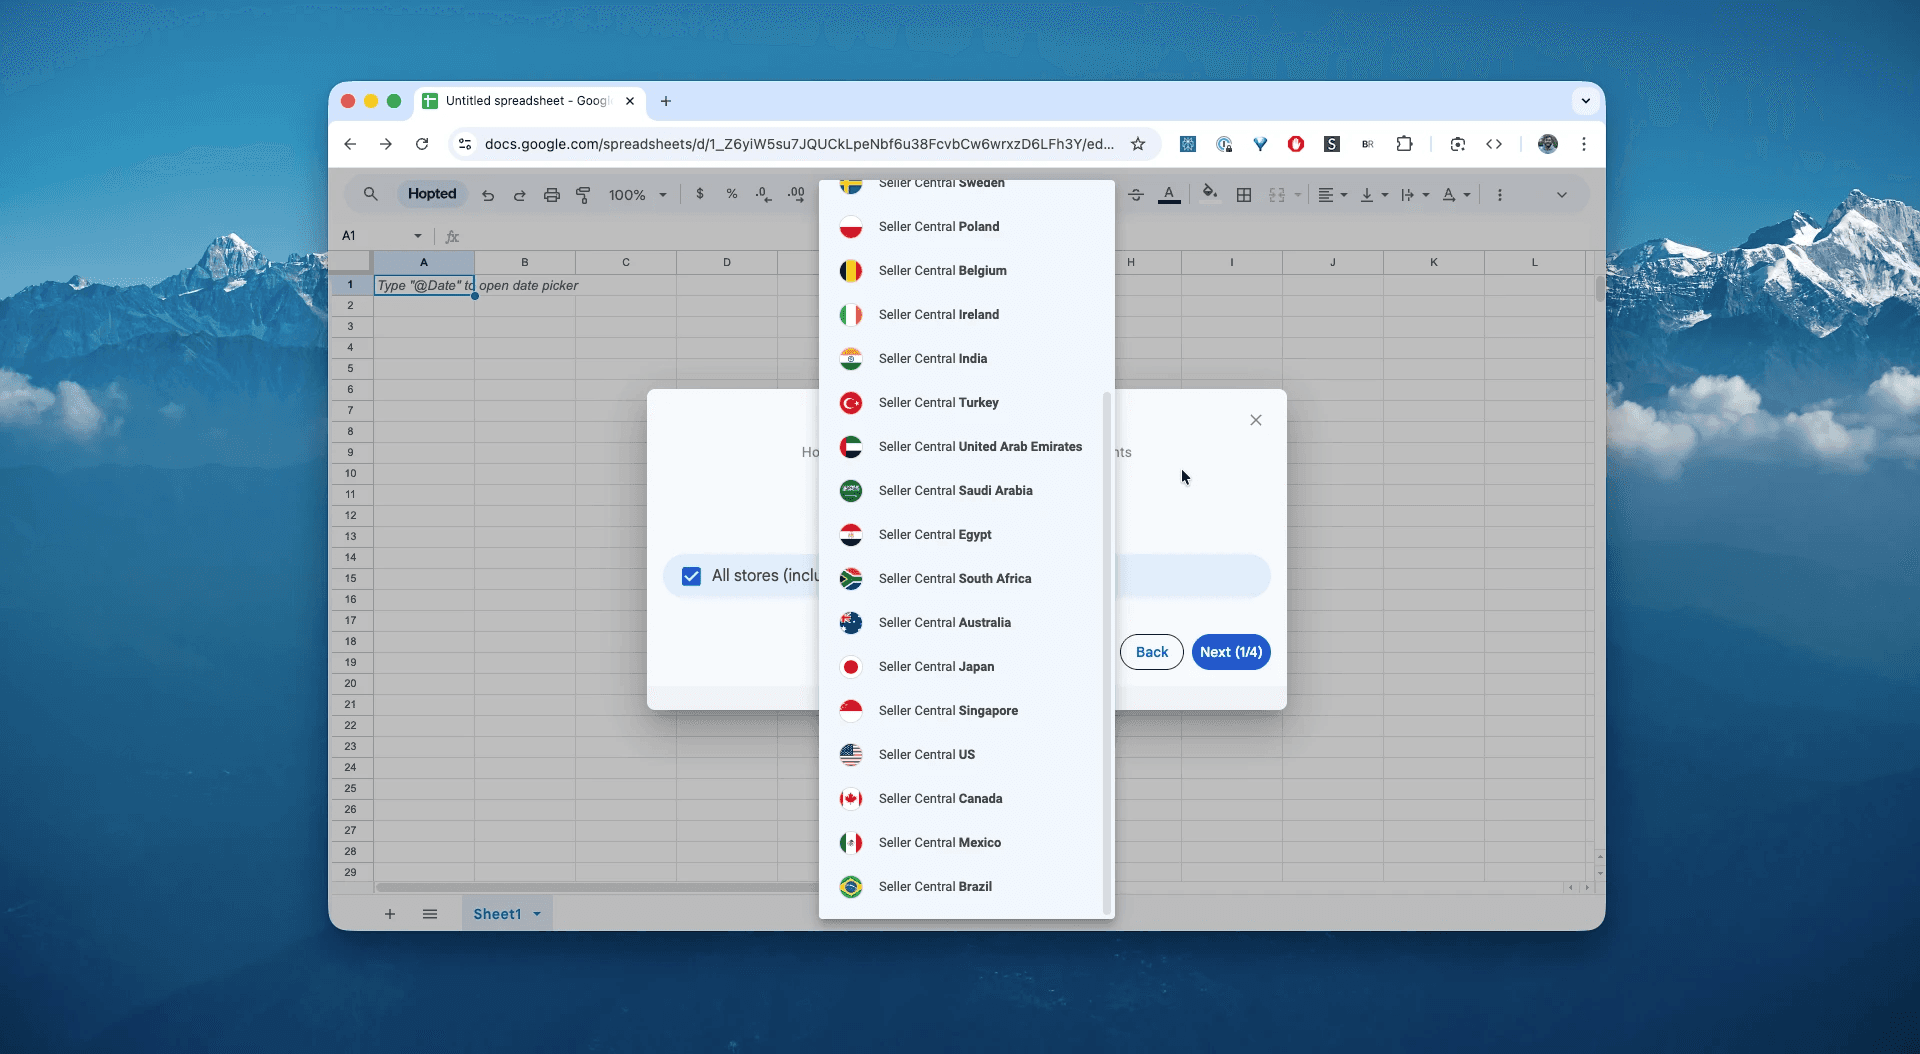
Securely connect your Amazon Seller Central to Google Sheets using Hopted's integration wizard.
Step 3.
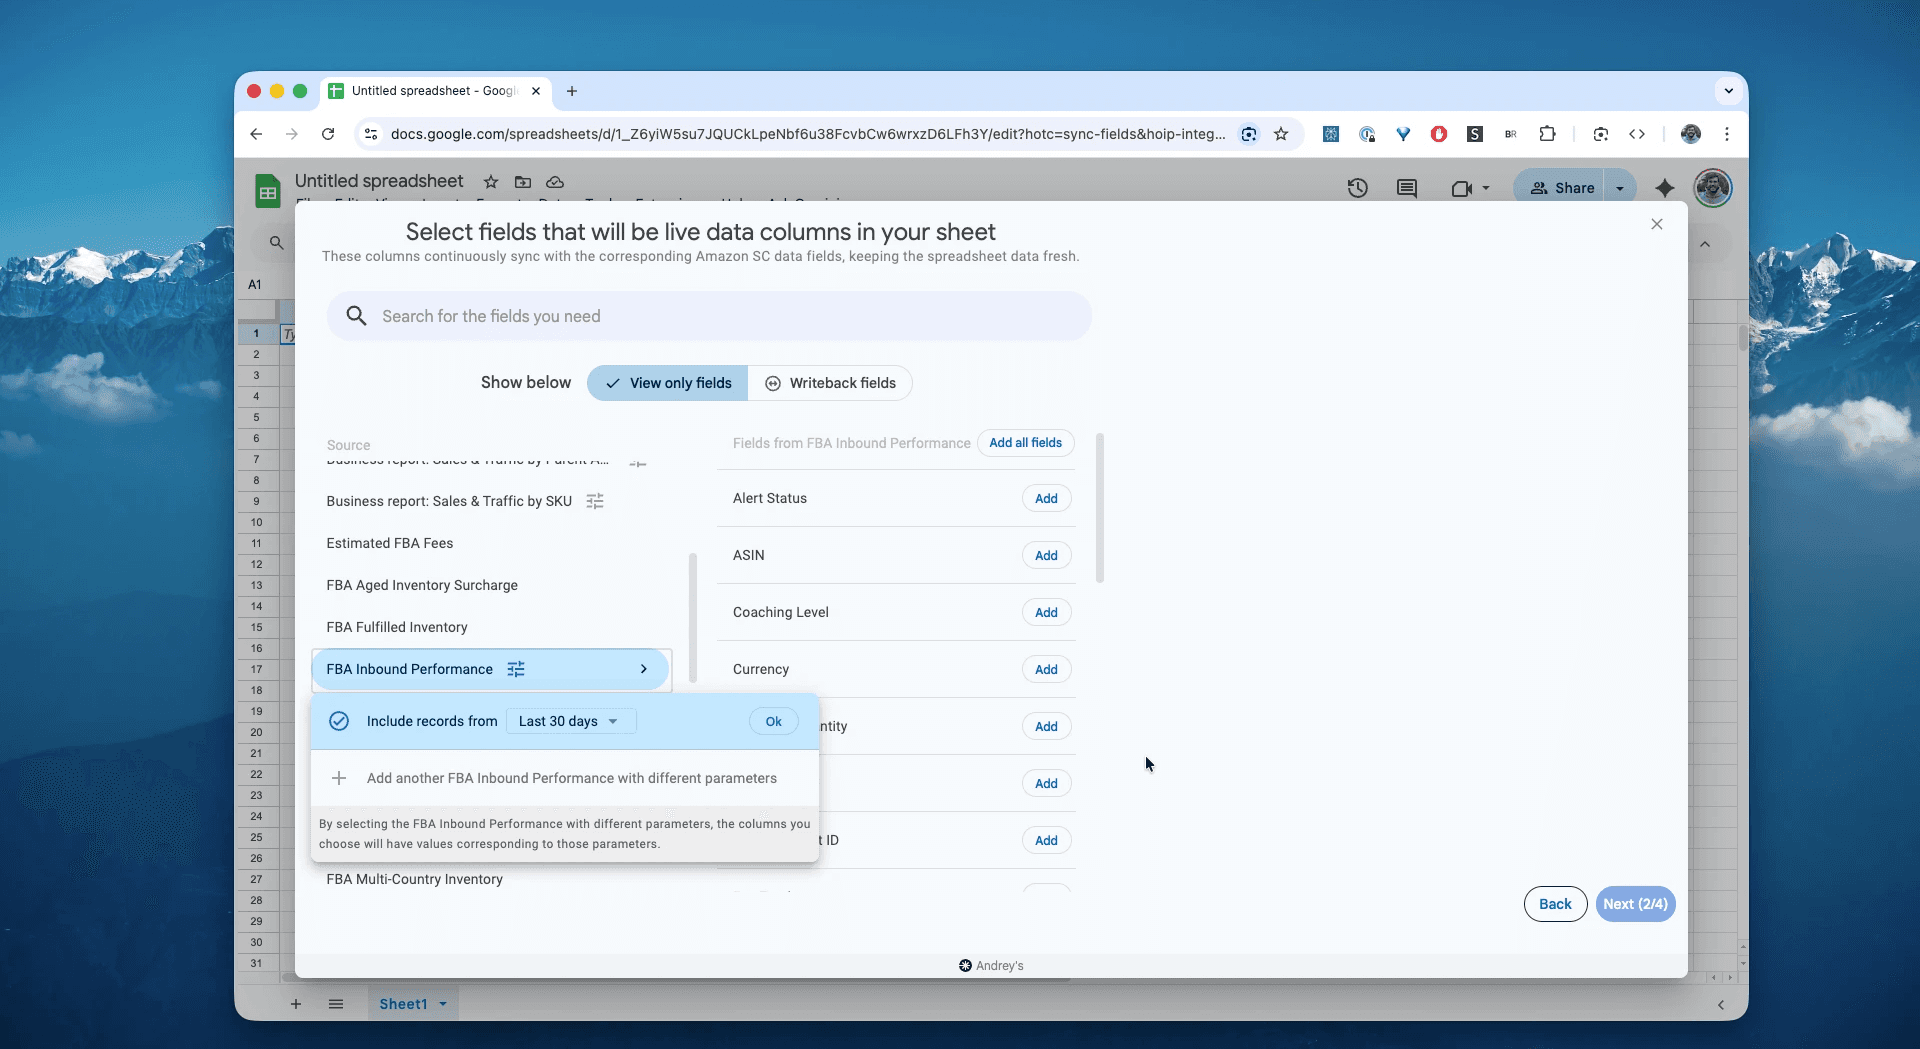
In Google Sheets, from the list of available Amazon Seller Central reports, select "FBA Inbound Performance" for a specific date range. This can be as recent as the "Last 24 hours" or a custom range going as far back as 35 months. For this example, we'll select "Include records for the last 30 days".
Step 4.
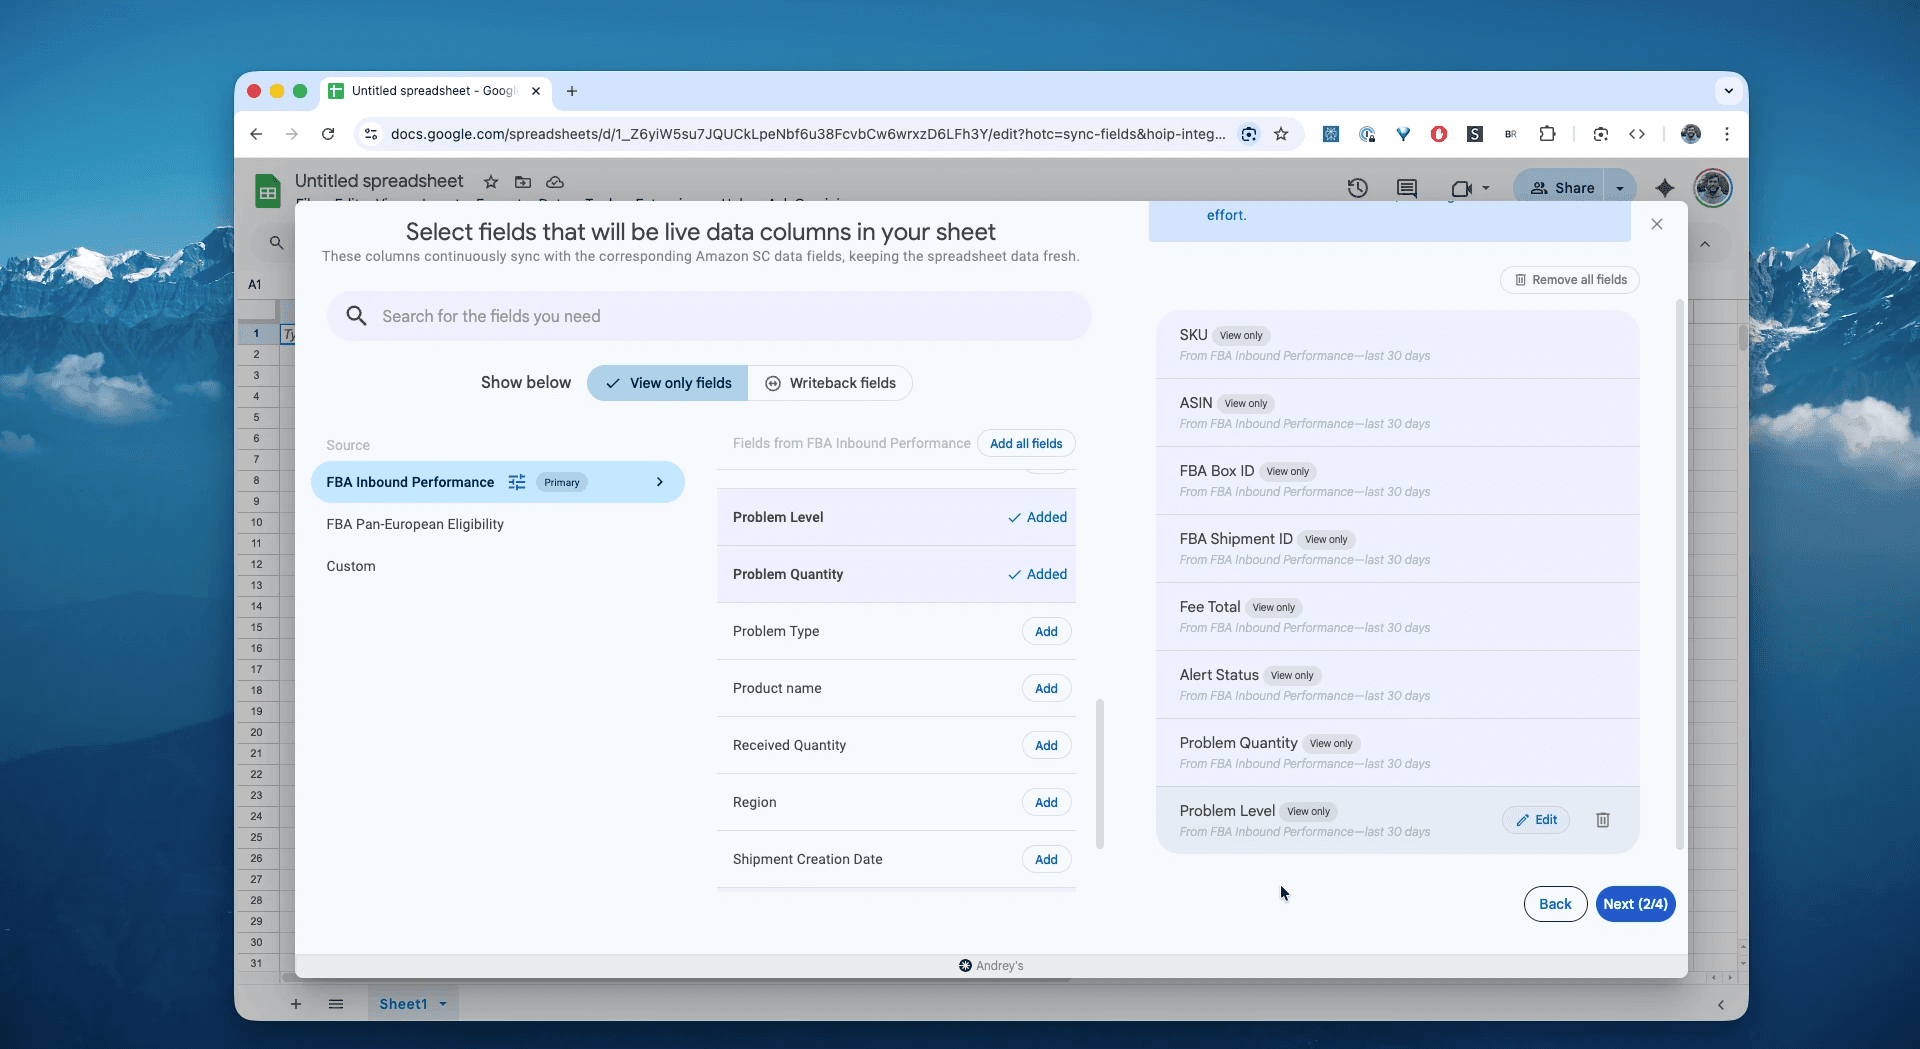
Select columns that you need: ASIN, SKU, FBA Box ID, FBA Shipment ID, Fee total, alert, problem level, problem quantity, and other fields.
Step 5.
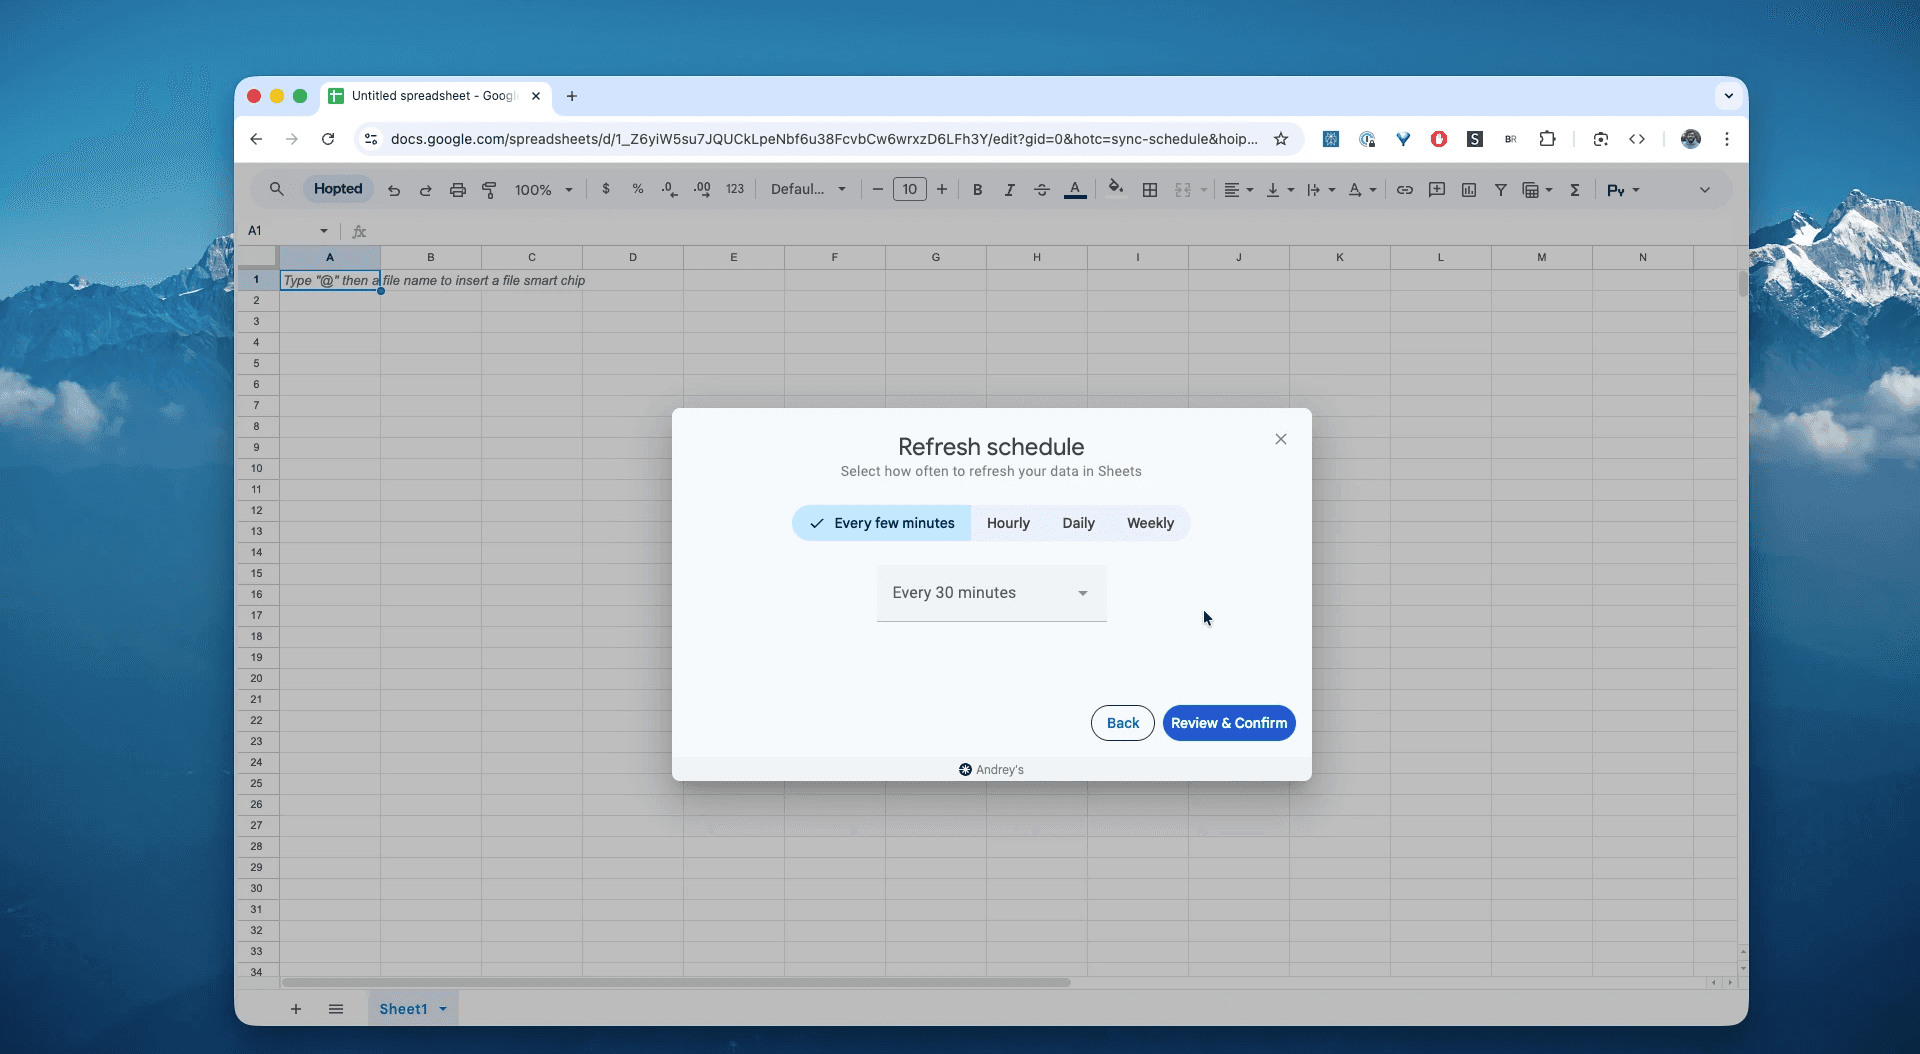
Set your schedule. Choose how often you want to export and refresh your inbound shipment issues—every hour, every day, or less frequent.
Step 6.
Save your data pipeline. This will export your FBA shipment defects and issues from Seller Central into spreadsheets instead of dealing with CSVs. These FBA issues in your spreadsheets will be up to data forever.
What is the FBA Inbound Performance Report?
This report is your central dashboard for FBA shipment health. It provides a detailed, shipment-level breakdown of any "defects" or problems Amazon's fulfillment centers found when receiving your inventory — by shipment, carton, SKU/FNSKU/ASIN—plus any related fees and alert/coaching levels. Amazon updates this report daily.
This makes it the single source of truth for answering questions like:
Which shipments incurred noncompliance/labeling fees, and how much?Which problem types are driving inbound defects by FC/SKU/week?Where are shortages or overages happening (expected vs. received)?Which 3PL/vendor/warehouse has the highest defect rate per 1,000 units?Which coaching levels / alert statuses need action to avoid suspension?Are barcode/label issues spiking for specific ASINs/FNSKUs?What’s our defect cost per unit and how is it trending?Which cartons/shipments should we dispute with case evidence today?Does my new prep center have a higher defect rate than my old one?Which ASIN gets flagged for 'Labeling Issue' most often?Are damaged items more common from a specific supplier?
How to Analyze & Track Your FBA Inbound Shipment Performance in Spreadsheets
Now that you have a live feed, you can move from data entry to data analysis. This is the real power of analyzing your Amazon Seller Central data in spreadsheets and building your Amazon excel-like template.
Here are 3 Amazon spreadsheet template ideas you can build immediately:
Template 1: The Prep Center / Supplier Scorecard
This is the ultimate tool for Amazon inventory management.
How to build it: Create a Pivot Table in Google Sheets.
Rows:
Supplier NameorPrep Center Name(you may need to add this from another sheet using VLOOKUP).Columns:
Problem TypeValues:
SUM of Quantity with ProblemsWhat it shows you: You'll instantly see which suppliers are responsible for the most "Damaged Items" and which prep centers are struggling with "Labeling Issues."
Template 2: The "Problem ASIN" Tracker
Find your most problematic products.
How to build it: Another Pivot Table.
Rows:
ASINColumns:
Problem TypeValues:
COUNT of Shipment IDWhat it shows you: This reveals if one specific ASIN is a magnet for issues. For example, if one ASIN makes up 80% of your "Unexpected Item" defects, you know to check your manufacturing or bundling process for that product.
Template 3: The Defect Rate Dashboard
Track your Amazon data at a high level.
How to build it: Use simple formulas on your raw data sheet.
Formula 1:
Total Defects = SUM(Quantity with Problems)Formula 2:
Total Units Received = SUM(Quantity Received)Formula 3:
Defect Rate = (Total Defects / Total Units Received)(Format as a percentage)What it shows you: You can plot this "Defect Rate" over time in a line chart. This is the #1 metric to show your team and your partners to prove if your inbound processes are improving.
Common workflows this report unlocks
Catch & contest fees (e.g., inbound defect/labeling fees) with shipment-level evidence.
Eliminate repeat defects (mislabeled cartons, overages/shortages, non-scannable barcodes) by pinpointing problem type × FC × prep/3PL.
Avoid shipping suspensions triggered by unresolved inbound alerts by proving corrective action.
Hit receiving SLAs (e.g., 45/75-day arrival windows) by monitoring delays tied to problem types/FCs.
FAQ about FBA inbound performance
Q: Can this help prevent inbound suspensions?
Yes—tracking unresolved issues and demonstrating corrective steps addresses inbound performance alerts that can otherwise restrict creating shipments.
Q: What are common “problem-types”?
Labeling errors, unit/quantity discrepancies, carton content mismatches, and barcode issues—use the report’s problem-type and performance-measurement-unit to quantify and prioritize.
Q: How do I download the Amazon FBA Inbound Performance report (TSV/CSV)?
Check out the guide above to automatically export this report into spreadsheets.
Q: What is the difference between “expected quantity” and “received quantity”?
Expected is what you declared; received is what FCs counted—use both to find shortages/overages by shipment or SKU.
Q: How do I calculate FBA inbound defect rate from this report?Defect rate = SUM(problem_quantity) / SUM(received_quantity) (format as %), filtered by date range.
Q: Can I track inbound non-compliance fees in the Inbound Performance report?
Yes—use fee-type and fee-total to quantify labeling/non-compliance fees by FC, problem type, or week.
Q: How do I identify the worst fulfillment centers (FC) for inbound issues?
Group by fulfillment-center-id with SUM(problem-quantity); add defects per 1,000 units for fair comparison.
Q: What does “coaching level” or “alert status” mean in the report?
They reflect Amazon’s severity/urgency indicators—use them to prioritize corrective actions and prevent restrictions.
Q: How do I dispute an inbound fee using report data?
Filter rows by shipment/carton and fee, compile evidence (POs/photos/BOL), then open a case referencing IDs in the report.
Q: Best way to export Amazon Inbound Performance data to Excel and keep it fresh?
Automate a daily export → staging tab → pivot/dashboard tabs with refresh rules and weekly snapshots. See the guide above.
Q: How do I track barcode/labeling errors for packaging QA?
Filter problem-type for label/barcode issues, trend by week, and flag ASINs with repeated non-scannables.
Q: Can I merge multiple marketplaces into one inbound compliance dashboard?
Yes—append marketplace code to each row, then pivot by marketplace to compare defect rates and fees.
Q: How do I prevent inbound performance suspensions proactively?
Monitor alert-status ≠ “Resolved,” assign owners, and reduce recurring problem-type with supplier/3PL SOPs.
Q: How do I set up alerts when inbound defects spike?
Create conditional notification for exported columns directly in Google Sheets. In the Google Sheets top bar Tools → Conditional notifications. Trigger when problem-quantity or fees/unit exceeds thresholds; email Slack alerts to ops/3PL.
Q: How is Hopted different from other Amazon seller software?
Most Amazon tools force you into their rigid dashboards and pre-built reports. You have to change your workflow to fit their software. With Hopted is the opposite. It’s a flexible data automation layer that works directly inside your existing spreadsheets (like Google Sheets). Instead of forcing you to learn a new system, Hopted brings all your scattered Amazon data (sales, inventory, orders, etc.) right to you. You can build the fully custom reports and automations you need, not the ones a rigid tool dictates.


Hopted,
explained.
Watch the film