Storage fees are the silent killer of Amazon FBA margins. You might think you're profitable, but if your "slow movers" are racking up thousands in monthly rental charges, your bottom line is bleeding out. The FBA Monthly Storage Fees Report is your itemized bill for every cubic foot of space you rent from Amazon. It’s not just an invoice—it’s a diagnostic tool. This guide shows you how to stop paying blindly and start optimizing. We'll cover how to automatically pull your Monthly Storage Fees report directly into Google Sheets to build a live "Inventory Rent" dashboard.

How to Automatically Sync & Import the Monthly Storage Fees Report to Google Sheets (The Hopted Way)
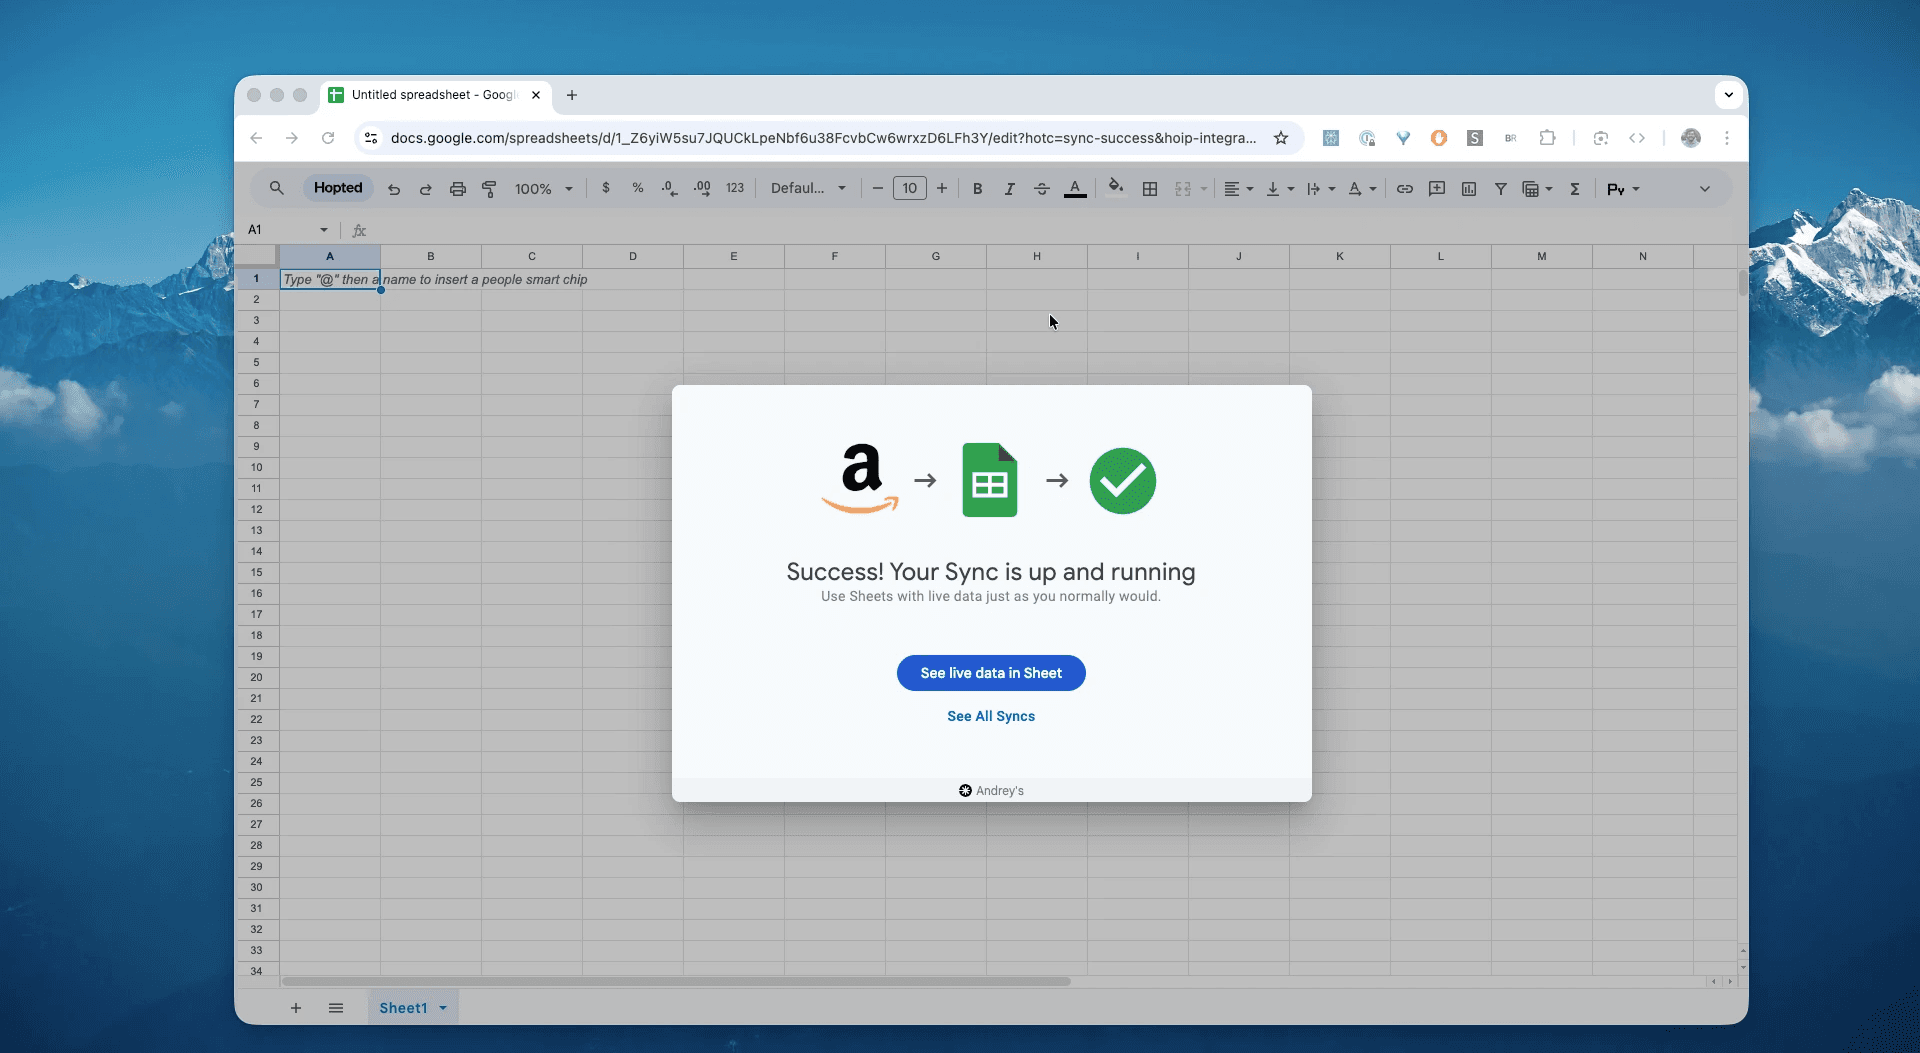
Using an Amazon to Google Sheets integration like Hopted, you set up the connection once, and your data flows automatically.
Step 1.
Install the Hopted browser extension and sign in using your Google Account.
Step 2.
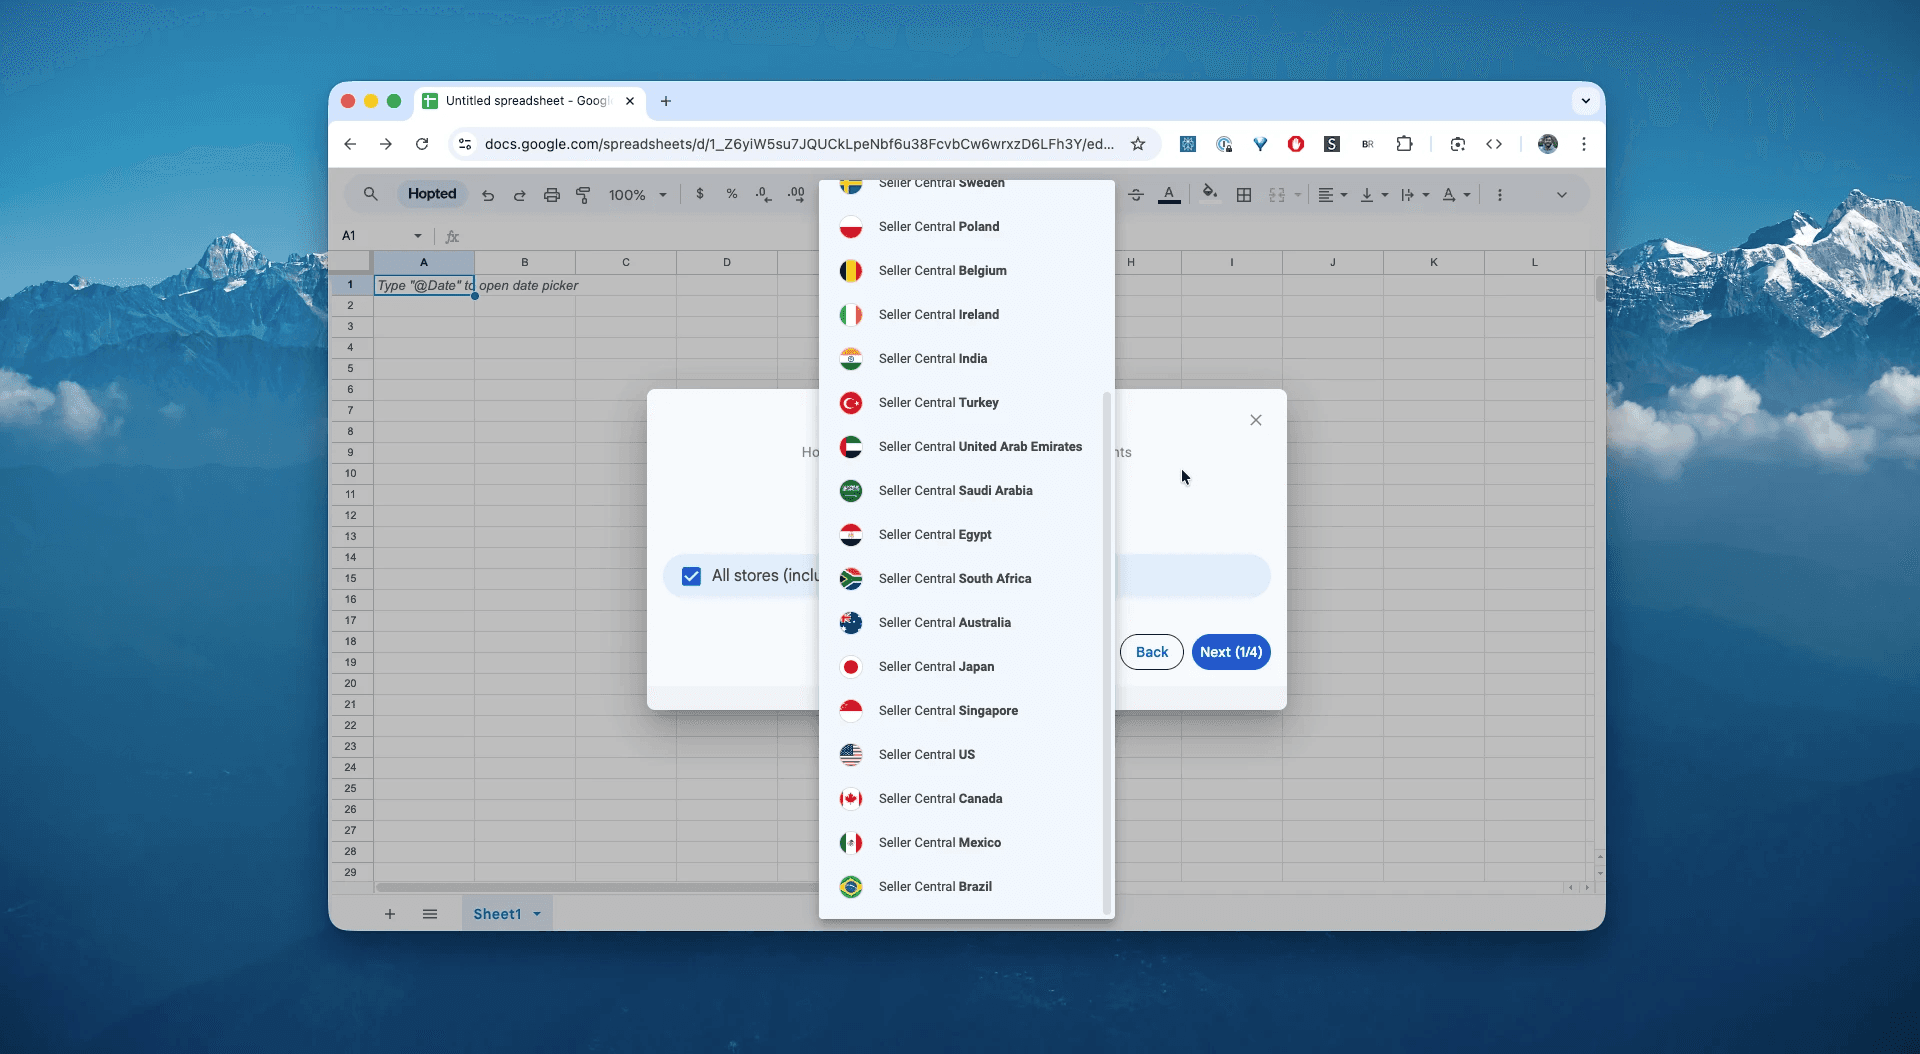
Securely connect your Amazon Seller Central to Google Sheets using Hopted's integration wizard.
Step 3.
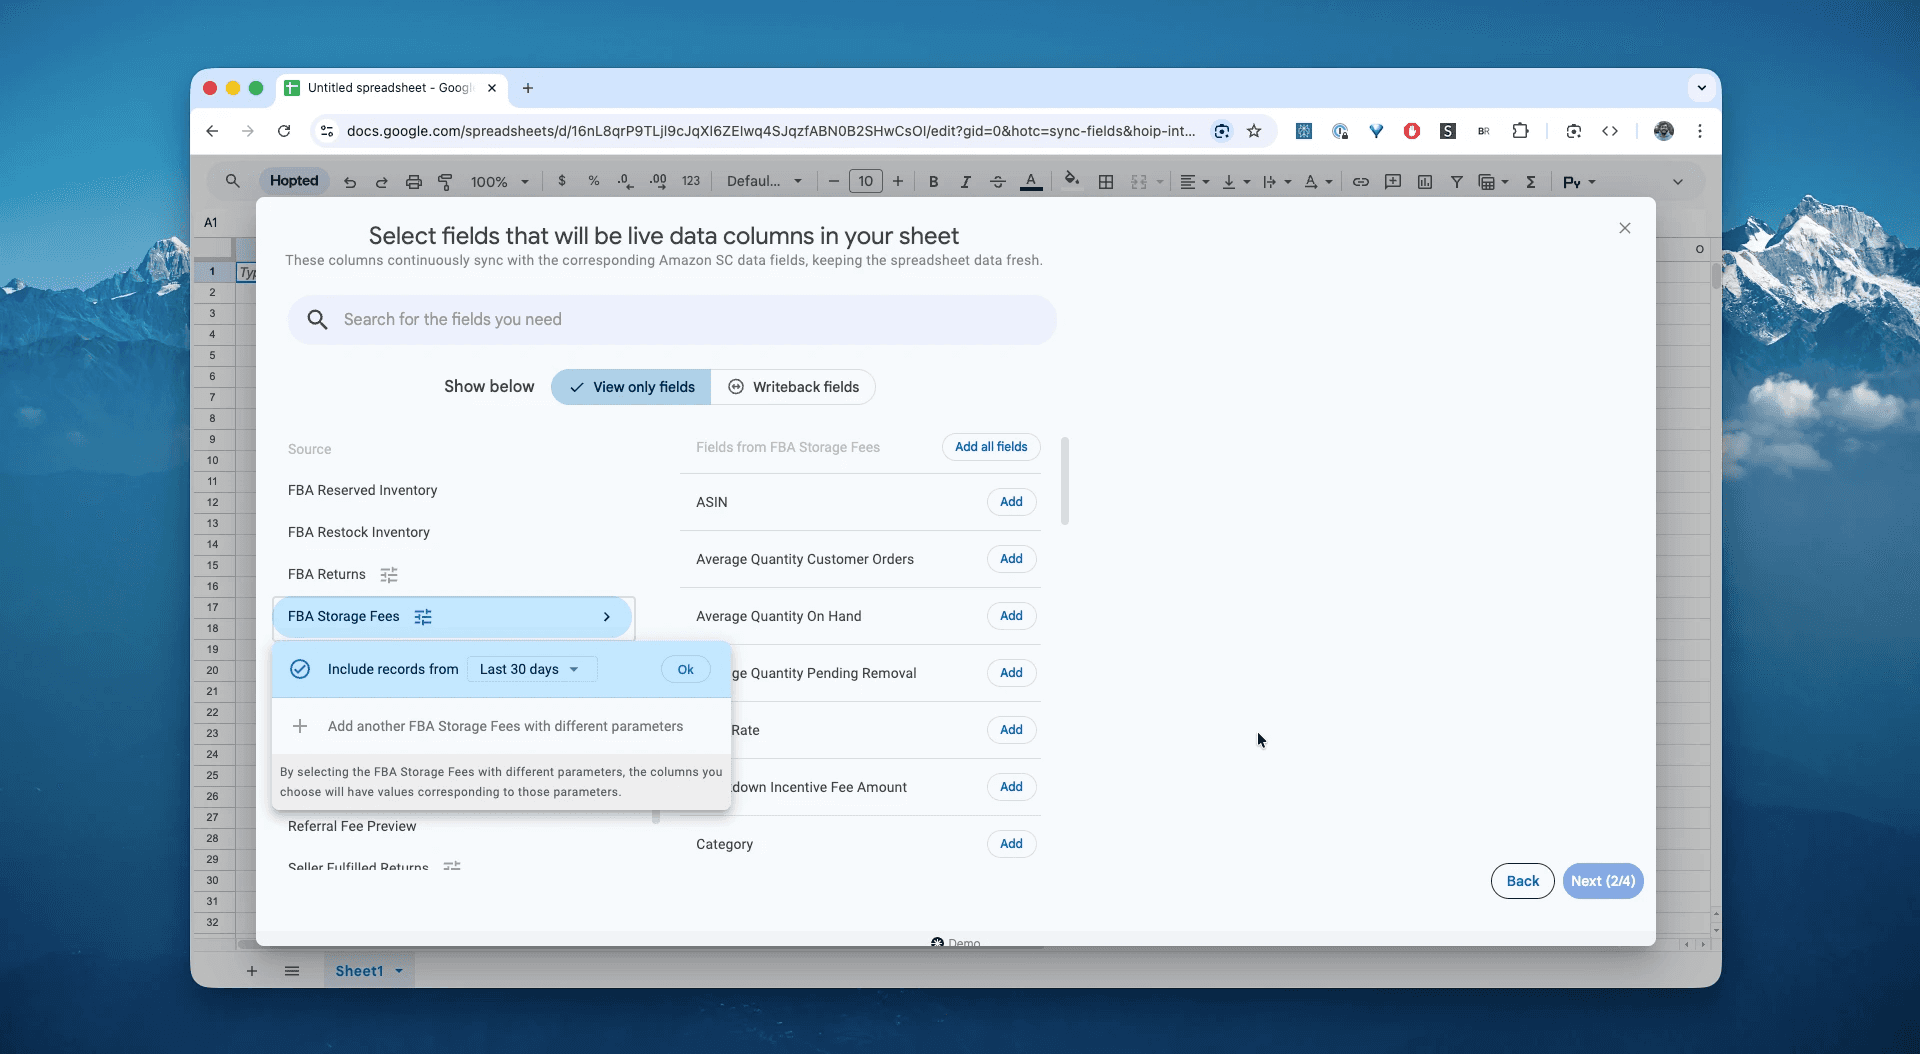
In Google Sheets, from the list of available Amazon Seller Central reports, select "FBA Storage Fees" for a specific date range. This can be as recent as the "Last 24 hours" or a custom range going as far back as 35 months. For this example, we'll select "Include records for the last 30 days".
Step 4.
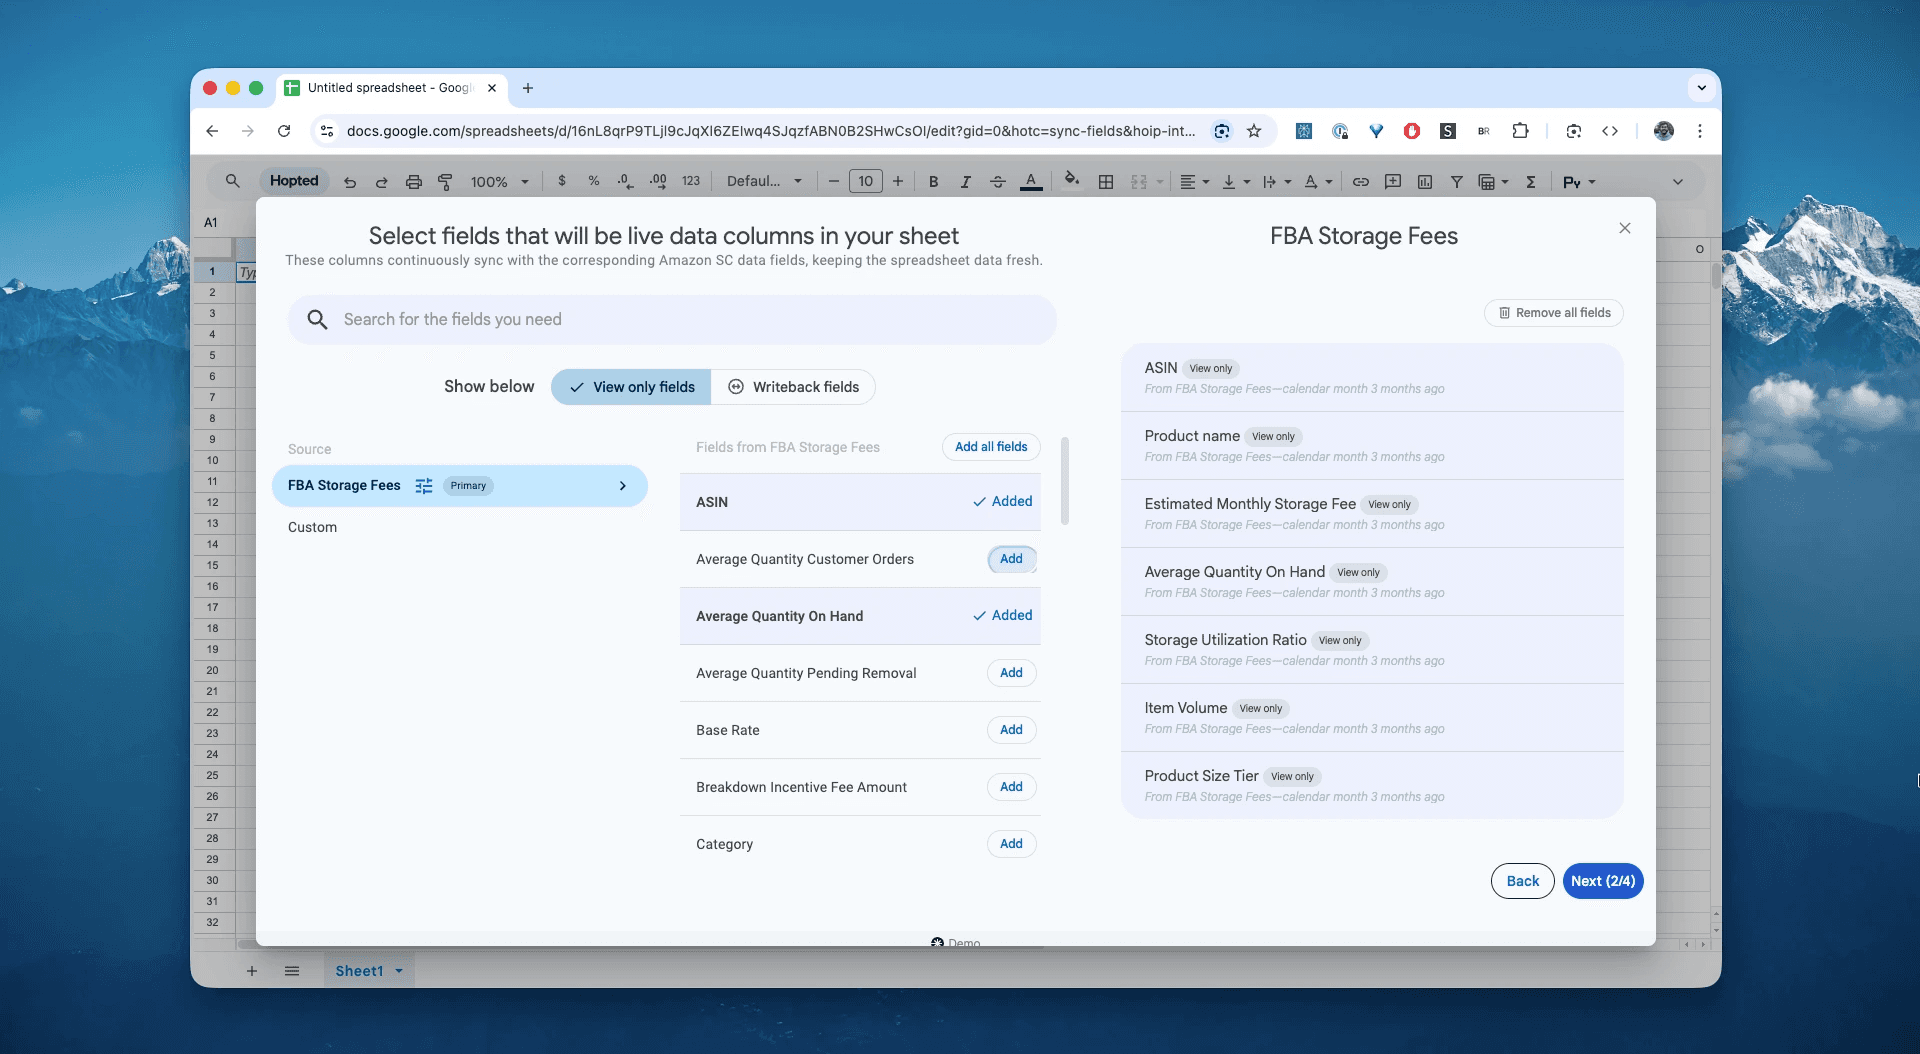
Select columns that you need: asin, product-name, estimated-monthly-storage-fee, average-quantity-on-hand, storage-utilization-ratio, utilization-surcharge-rate, item-volume, and product-size-tier.
Step 5.
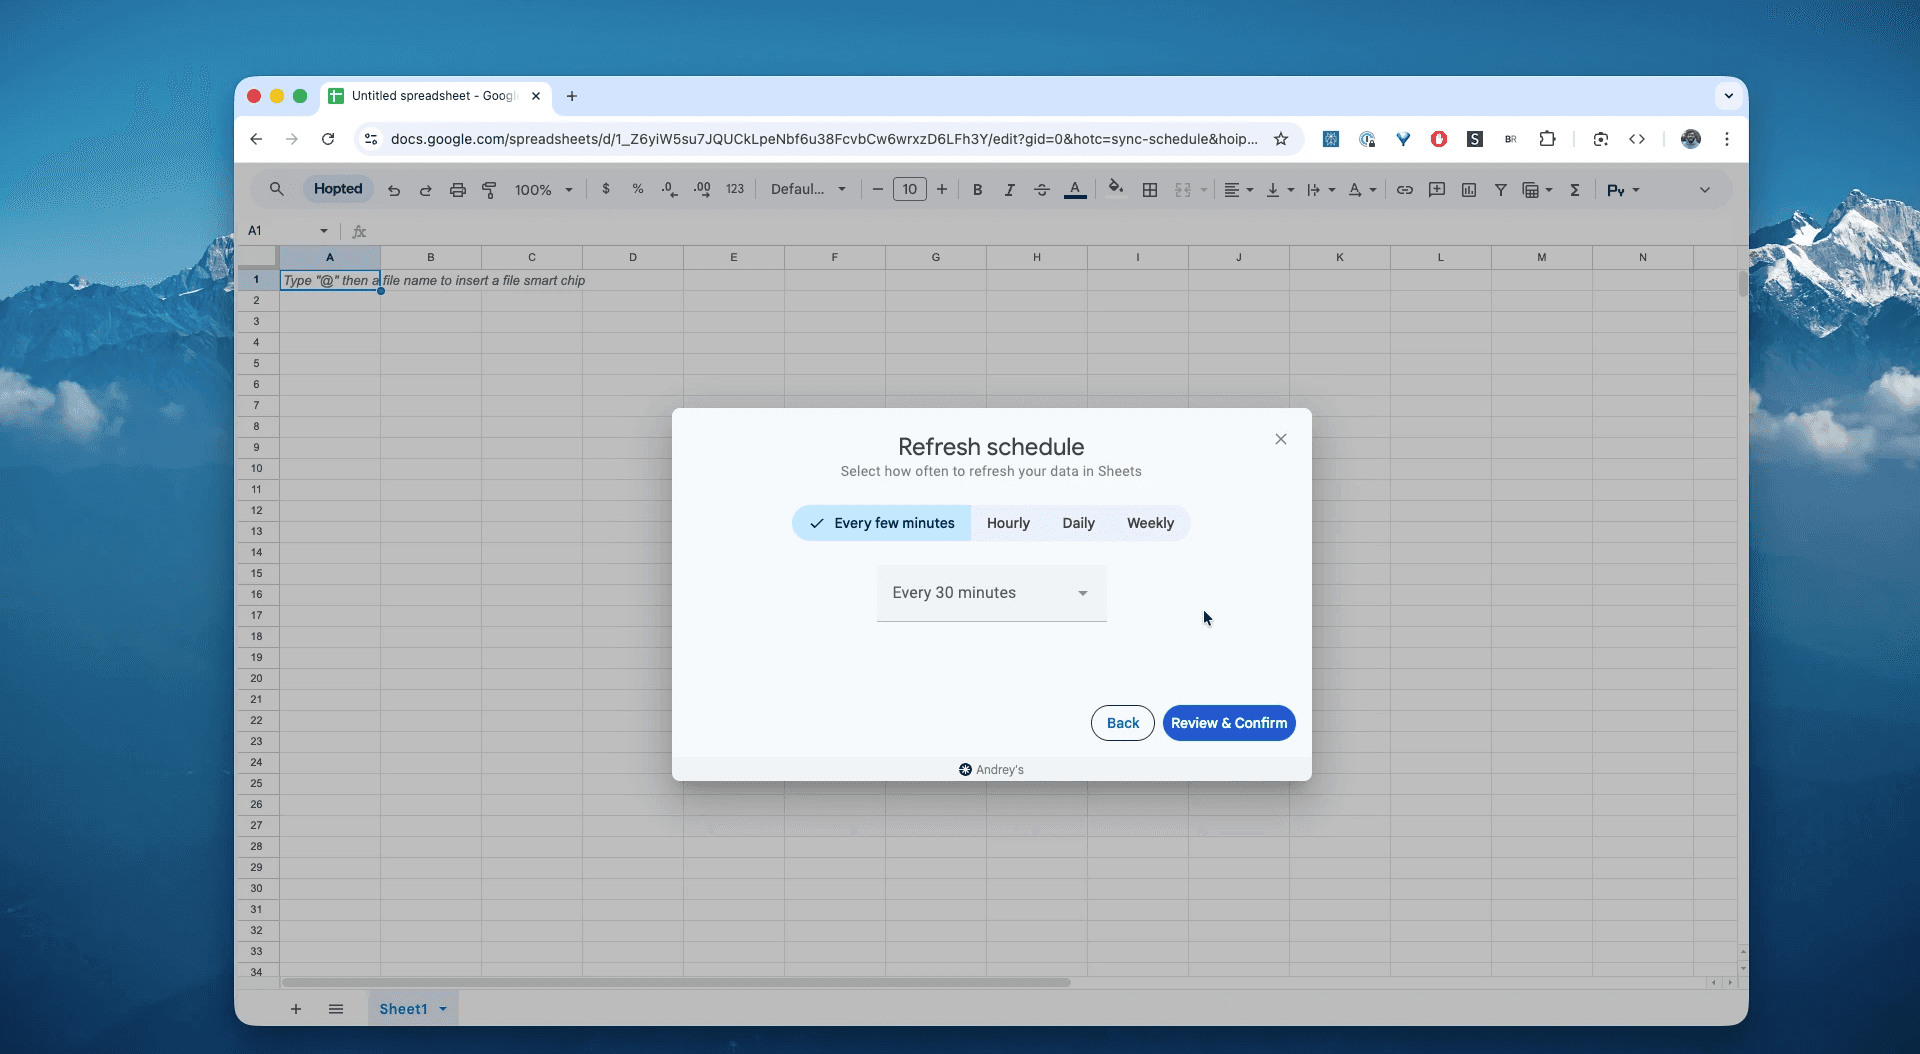
Set your schedule. Choose how often you want to export and refresh your storage fee data—we recommend a daily schedule.
Step 6.
Save your data pipeline. This will export your storage fee history from Seller Central into spreadsheets instead of dealing with CSVs. Your fee analysis dashboard will be up to date forever.
What is the Amazon Monthly Storage Fees Report?
This report provides the estimated monthly inventory storage fees for each ASIN in your catalog. It details exactly how much "rent" each product is costing you based on the space it occupies in Amazon's fulfillment centers.
Beyond just the dollar amount, this report reveals the drivers of your costs, including the Storage Utilization Surcharge(a penalty for holding too much stock relative to your sales) and the Product Size Tier (which determines your rate per cubic foot).
This makes it the single source of truth for answering questions like:
Which 20% of my products are generating 80% of my storage bill?Am I paying "Oversize" storage rates for a product that should be "Standard"?Which ASINs are triggering the expensive "Storage Utilization Surcharge"?How much is my "dead stock" costing me just to sit on the shelf each month?Why did my storage bill jump 3x in October? (Peak season rates).
How to Analyze & Track Your Monthly Storage Fees in Spreadsheets
Now that you have a live feed, you can move from data entry to data analysis. This is the real power of analyzing your Amazon Seller Central data in spreadsheets and building your Amazon excel-like template.
Here are 3 Amazon spreadsheet template ideas you can build immediately:
Template 1: The "Rent Control" Dashboard
Identify the products that are costing you the most to store, relative to how many units you actually have.
How to build it:
Sort: Sort your sheet by
estimated-monthly-storage-fee(Descending).Column: Add a calculated column
Fee Per Unit=estimated-monthly-storage-fee/average-quantity-on-hand.What it shows you: You might find that a cheap $10 accessory is costing you $0.50/month per unit in storage. If you don't sell it fast, the storage fees will quickly consume the entire profit margin.
Template 2: The "Surcharge" Alert System
The Storage Utilization Surcharge is a punitive fee for low-turnover sellers. You need to know which products are causing it.
How to build it:
Filter: Filter for rows where
estimated-storage-utilization-surchargeis greater than 0.Columns: Display
ASIN,average-quantity-on-hand, andstorage-utilization-ratio.What it shows you: A "Kill List" of products that are dragging down your IPI score and inflating your fees. These are the prime candidates for a Flash Sale, Outlet Deal, or Removal Order to stop the penalty fees.
Template 3: The "Dimensional Audit"
Sometimes Amazon re-measures your product and bumps it into a more expensive size tier (e.g., from Standard to Oversize), doubling your storage rate.
How to build it:
Pivot Table: Rows =
product-size-tier. Values =SUM of estimated-monthly-storage-fee.Deep Dive: Look for ASINs that you know are small but are listed as "Oversize" in the
product-size-tiercolumn.What it shows you: If a small item is flagged as "Oversize," you can request a "Cubiscan" (re-measurement) from Amazon to fix the error and get reimbursed for overcharges.
Common workflows this report unlocks
Profitability Analysis: Deduct storage fees from your Gross Margin per SKU to see the true Net Profit.
Q4 Planning: Forecast your October-December storage bills (which are typically 3-4x higher) using your current volume data.
Removal Strategy: Decide which units are cheaper to remove (pay $0.50 once) than to store (pay $0.30/month forever).
IPI Optimization: Improve your Inventory Performance Index by identifying and removing the heaviest "dead weight" in your inventory.
FAQ about Amazon Monthly Storage Fees
Q: Why is my storage fee higher in Q4 (October - December)? Amazon increases storage rates significantly (often 300-400%) during the busy holiday season to discourage sellers from sending in slow-moving inventory. This report helps you predict that spike.
Q: What is the difference between Monthly Storage Fees and Aged Inventory Surcharge?
Monthly Storage Fees: The standard "rent" you pay for all inventory every month.
Aged Inventory Surcharge: A penalty fee (formerly Long-Term Storage Fee) charged on top of the monthly fee for items that have been in the warehouse for more than 181 days.
Q: How is the Storage Utilization Surcharge calculated? It is based on your Storage Utilization Ratio (your average daily inventory volume divided by your average daily shipped volume over the last 13 weeks). If this ratio is too high (meaning you hold a lot but sell a little), you get hit with the surcharge.
Q: Does this report include removal orders? The column average-quantity-pending-removal shows units you have asked Amazon to remove or destroy. Amazon generally stops charging storage fees on these units once the removal order is placed, even if they haven't physically left the building yet.
Q: How is Hopted different from other Amazon seller software? Most Amazon tools force you into their rigid dashboards and pre-built reports. You have to change your workflow to fit their software. With Hopted it is the opposite. It’s a flexible data automation layer that works directly inside your existing spreadsheets (like Google Sheets). Instead of forcing you to learn a new system, Hopted brings all your scattered Amazon data (sales, inventory, orders, etc.) right to you. You can build the fully custom reports and automations you need, not the ones a rigid tool dictates.


Hopted,
explained.
Watch the film