All use cases / Brand managers
Own the numbers behind your Amazon brand’s growth
You own the forecast, the ad budget and the contribution margin. Bring Seller Central and Amazon Ads into the Google Sheets your team uses to review performance, coordinate stock and decide what needs attention.

Trusted every day by modern Amazon teams





Contribution, stock and catalog health. In the same working model.
Keep the numbers behind your growth plan together, with the cost inputs and assumptions that make them useful.
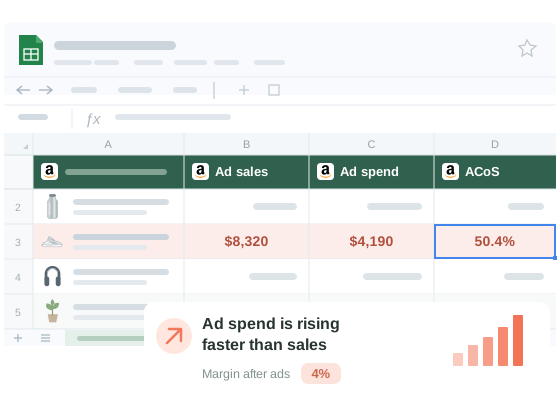
Review contribution after COGS, fees and ads
Bring Amazon fees and advertising spend into your model. Add COGS and other business costs, then use your formulas to review SKU-level contribution and the assumptions behind it.
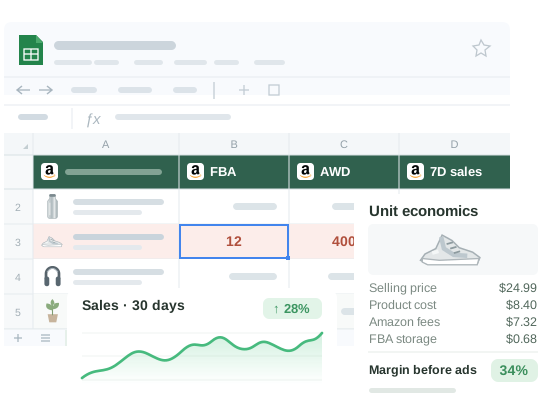
Keep bestsellers available and slow movers in view
Compare sales velocity with FBA and AWD stock, aging inventory and Amazon’s excess-stock estimates. Add lead times, buffer stock and your product costs to review stockout risk, cash tied up in stock and the priorities to discuss with supply chain.
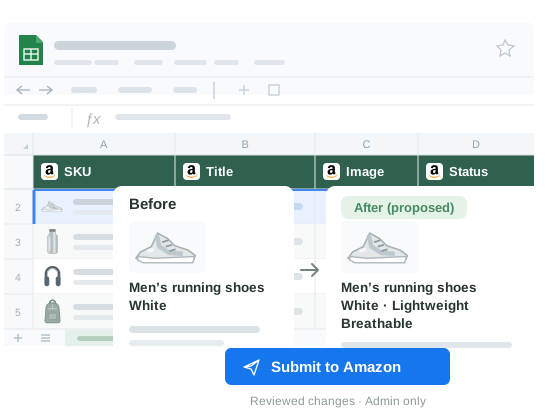
Keep catalog exceptions moving toward resolution
Review suppressed listings, incomplete details and account-health signals in one exception review. Add your team’s owner, status and follow-up notes. When a supported listing edit is needed, prepare it in Writeback columns, preview the changes and have an admin submit them.
What changed? What did you do? What is the commercial impact?
Find what sits behind a sales change
Sales below target? Compare sessions, conversion, ad spend, stock and Buy Box context for the affected SKU and marketplace. Use the workbook to narrow the investigation, record the next action and give PPC or operations the context they need.
Give PPC the commercial context
Review ACoS and ROAS alongside Seller Central sales. Calculate TACoS in your workbook, and give your PPC specialist or agency the stock and margin context behind the ad results.
Explain the result in the weekly review
Share a current workbook with leadership, finance, PPC and operations. Keep commentary and next actions beside the numbers, with the source account and marketplace still visible.
Keep the model your team already runs
Schedule linked data updates while keeping your formulas, forecasts, notes, column order and formatting. Build on the spreadsheet your team already uses to run the brand.
Review launches and promotions together
Add launch dates, targets and readiness notes beside linked sales, traffic, advertising and stock. Compare performance before, during and after a launch or promotion, using your cost assumptions to review the result and record what to change next.
Run the portfolio with each market in view
Compare brands, accounts and marketplaces in one working workbook. Keep the source account, marketplace, reporting period and currency beside sales, contribution, stock risks and next actions. Keep currencies separate or apply your team’s own conversion assumptions.
Questions & Answers
Yes. Hopted refreshes linked Amazon data while preserving your formulas, notes, column order and formatting. Add your own COGS, operating costs, lead times and planning assumptions, and use your spreadsheet formulas to calculate contribution and stock coverage.
Yes. Connect the Seller Central and Amazon Ads accounts your team manages. Combine their data in a master workbook or keep separate workbooks, with source account and marketplace context available alongside the numbers.
Choose a scheduled import interval for each data source. New values depend on Amazon’s report availability and reporting delays. Many PPC reports update once or twice daily, so an import schedule does not make every report real-time.
Yes. Prepare supported listing edits in Writeback columns, preview the proposed changes, and have a Hopted account admin submit the reviewed updates to Amazon. Available fields depend on your account, product type and marketplace.
Hopted supplies the data for your analysis and planning. Your team manages bids and campaigns in its advertising tools, decides replenishment quantities, and arranges procurement and shipments.
Hopted also has a separate Amazon Vendor Central connector for your 1P business. Use the reports for the model you manage, keeping Seller Central sales, your own contribution calculations and Amazon’s vendor metrics distinct.
Take the next step.
Work with Amazon data in Google Sheets — without manual exports.
