Vendor Sales & Profitability: export and sync to Google Sheets
Review shipped sales, costs, Net PPM, and customer returns by ASIN. Manufacturing view adds ordered sales and traffic.
What this report tells you
Vendor Sales & Profitability brings Amazon’s native retail sales and profitability metrics into Google Sheets through Data Kiosk. Review shipments, returns, discounts, and costs together by ASIN and marketplace. Net PPM describes Amazon’s profitability from your products; calculating your own profit also requires your costs and commercial terms.
Useful columns to start with
- ASIN — Match each product with your other Vendor reports.
- Period start and Period end — Keep the reporting window visible.
- Shipped units and Shipped revenue — Review products shipped to customers.
- Shipped COGS and Contra COGS — Compare Amazon’s reported costs.
- Net PPM — Review Amazon’s Net Pure Product Margin.
- Customer returns — Track returned items in each period.
- Currency — Identify the selected report currency.
How to export Vendor Sales & Profitability to Google Sheets
1. Connect Amazon Vendor Central to Google Sheets
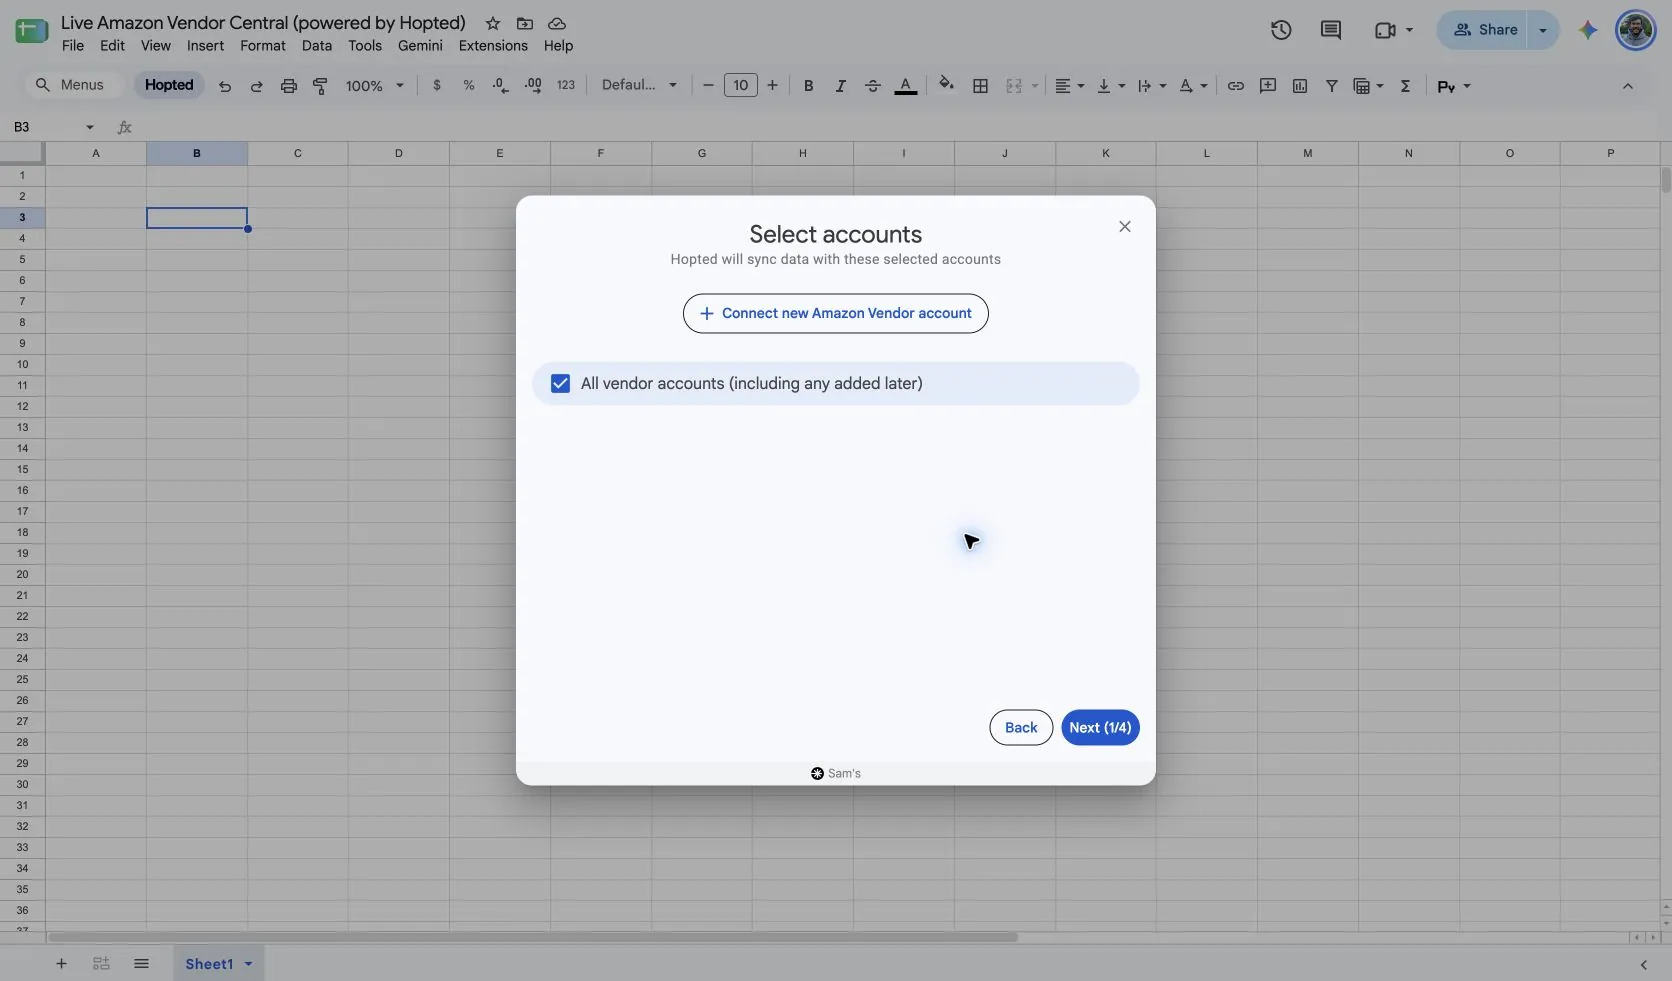
Install Hopted and sign in. Open your Google Sheet, click Hopted, then Add new data sync and Amazon Vendor Central. Select your vendor accounts.
Start with one vendor account and marketplace so the first import is easy to compare with Vendor Central. Add other accounts after checking that their product coverage and reporting settings match your intended review.
2. Choose the report and starting columns
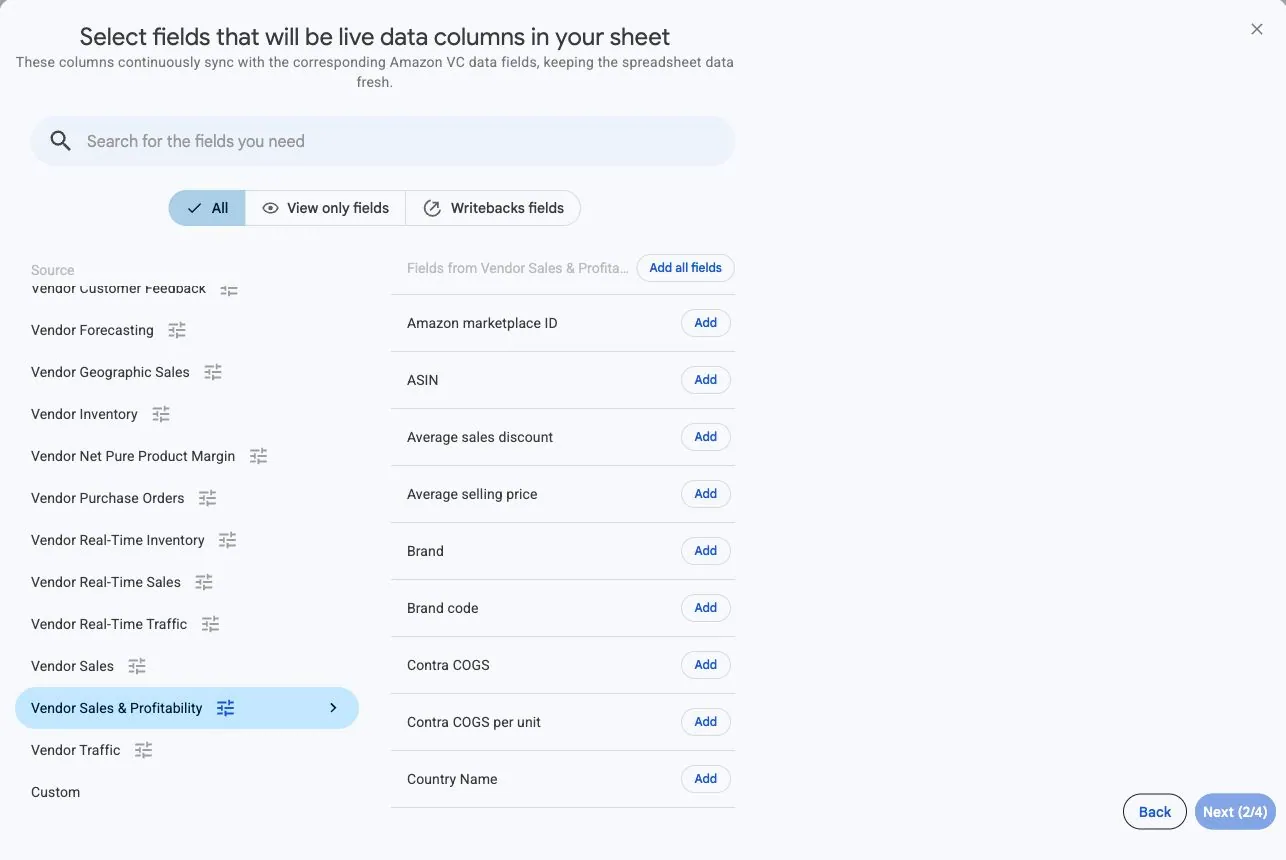
Choose Vendor Sales & Profitability and add the columns you need.
Start with ASIN, Period start, Period end, Shipped units, Shipped revenue, Net PPM, Customer returns, and Currency. Add Shipped COGS and Contra COGS for a cost review. Keep the account and marketplace fields visible so similar products from different accounts remain distinct.
3. Set the source options
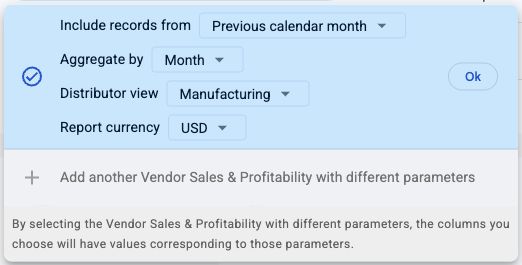
Choose Include records from, Aggregate by, Distributor view, and Report currency. Start with a completed calendar month; Day, Week, and Month periods are supported.
For a monthly review, choose Previous calendar month and Month. Use the distributor view that matches the Vendor Central figures you compare. Select the report currency deliberately; keep the returned Currency column with all monetary values. This source does not have a Selling program selector.
4. Review optional filters
Leave filters unset for the first broad check, or limit the import to a product you recognize. If an expected ASIN is missing, check the account, marketplace, distributor view, reporting dates, and filters before assuming it had no activity.
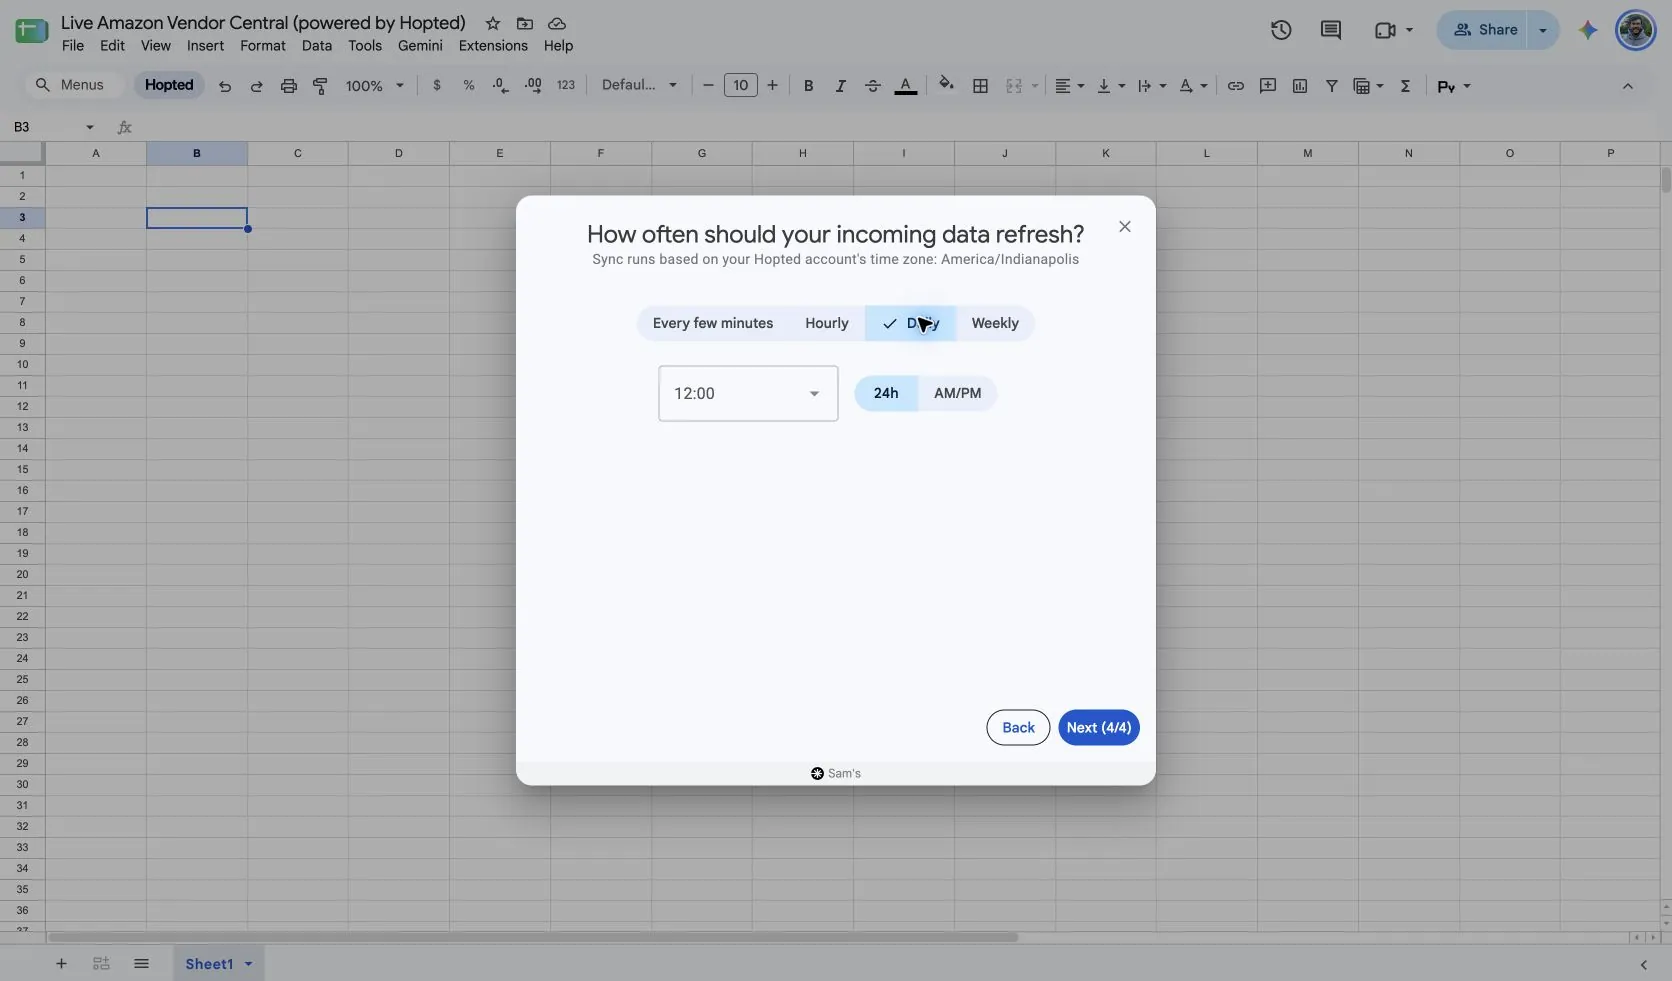
5. Choose a refresh schedule
Choose the cadence and time that fit your review. Check the time zone shown for your Hopted account. A daily refresh is a practical starting point for a daily review, while Amazon’s own publication timing still determines when new data becomes available.
6. Create the Sync and check the imported rows
Review the configuration and choose Create new Sync. Check the imported rows before adding calculations.
For one ASIN, confirm Period start, Period end, marketplace, Currency, and distributor view against the comparison you use in Vendor Central. Format Net PPM as a percentage. Treat blank values separately from zero, and check for duplicate dimensions before joining another worksheet.
How to use the report
Compare shipped revenue, returns, and Net PPM for the same ASIN across matching periods. Use Manufacturing view when you also need ordered units, ordered revenue, net ordered GMS, net shipment GMS, unfilled ordered units, glance views, or Lost Featured Offer rate. These additional metrics are unavailable in Sourcing view.
Compare product volume and selling value
Sort Shipped revenue to find the products driving retail sales, then compare Shipped units over matching periods. If one ASIN moves from 100 units and 2,000 in revenue to 80 units and 1,760 in the same currency, units fell while revenue per unit rose. Review Average selling price and product context before attributing the change to demand alone.
Investigate a change in Amazon’s margin
Keep Net PPM next to Shipped revenue, Shipped COGS, Contra COGS, and Sales discount. A move from 0.25 to 0.20 is a change from 25% to 20%, or five percentage points. Use those companion metrics to choose which commercial details to investigate; do not substitute a sum or simple average of ASIN margins for Amazon’s reported metric.
Review ordered and shipped activity together
In Manufacturing view, compare Ordered units and Shipped units, then inspect Unfilled ordered units for additional context. A period with 120 ordered units and 100 shipped units does not by itself prove 20 lost sales. Orders and shipments describe different stages, and ordered metrics can include adjustments for earlier sales. Check matching periods and Vendor Inventory before assigning a cause.
What to check before comparing results
Keep marketplace, distributor view, currency, and periods consistent. Manufacturing covers products you manufacture; Sourcing covers products supplied directly by your vendor group. Availability depends on Amazon’s access rights and publication timing. A refresh retrieves available data rather than making recent periods final.
Net PPM and Lost Featured Offer rate are fractions: 0.25 displays as 25% with percentage formatting. Do not sum percentages, average selling price, or per-unit metrics across rows.
Questions and answers
Does this replace Vendor Sales?
It is a separate Data Kiosk source with sales and profitability metrics together. Existing Vendor Sales syncs remain separate; choose the source whose fields and settings fit your review.
Does Net PPM show my company’s profit?
No. Net PPM measures Amazon’s profitability from your products. Your own profit calculation needs your costs, terms, and other relevant business expenses.
Why are ordered sales or traffic missing?
Ordered sales, glance views, and Lost Featured Offer are Manufacturing-only metrics. Check Distributor view and your Amazon access rights. A blank value in Sourcing does not mean zero demand.
Why does a recent period look incomplete?
Amazon may still be publishing data for recently completed periods. Confirm that the dates form complete days, weeks, or months, then compare the same account, marketplace, view, and currency. Refreshing more often cannot remove Amazon’s publication delay.
Sources and verification
Report names, example fields, and settings reflect Hopted’s supported source configuration as of November 16, 2026.
See the Amazon Vendor Central connector or return to the Vendor Central reports directory.