Vendor Net Pure Product Margin: export and sync to Google Sheets
Review Amazon’s Net PPM for your products and prepare informed retail profitability discussions.
What this report tells you
Vendor Net Pure Product Margin reports Amazon’s profitability from selling your vendor products. It is useful when a commercial review needs more context than retail sales alone. Bringing Net PPM into Google Sheets lets you review changes by ASIN and reporting period, alongside sales and catalog information. It does not calculate your business’s manufacturing margin, cash profit, or full cost to serve Amazon.
Useful columns to start with
Choose a focused set of columns for your task. These are examples from Hopted’s current Vendor picker, rather than an exhaustive field list.
- ASIN — Identify the product associated with the reported margin.
- Net Pure Product Margin — Review Amazon’s profitability measure, stored as a fraction.
- Start Date — Keep the start of each reported period visible.
- End Date — Match the margin period to your sales review.
- Marketplace Country Code — Separate margin reviews by marketplace.
Keep Store name, marketplace, date or time fields, and Currency where available. This context helps keep different accounts, periods, and monetary amounts distinct.
How to export Vendor Net Pure Product Margin to Google Sheets
1. Connect Amazon Vendor Central to Google Sheets
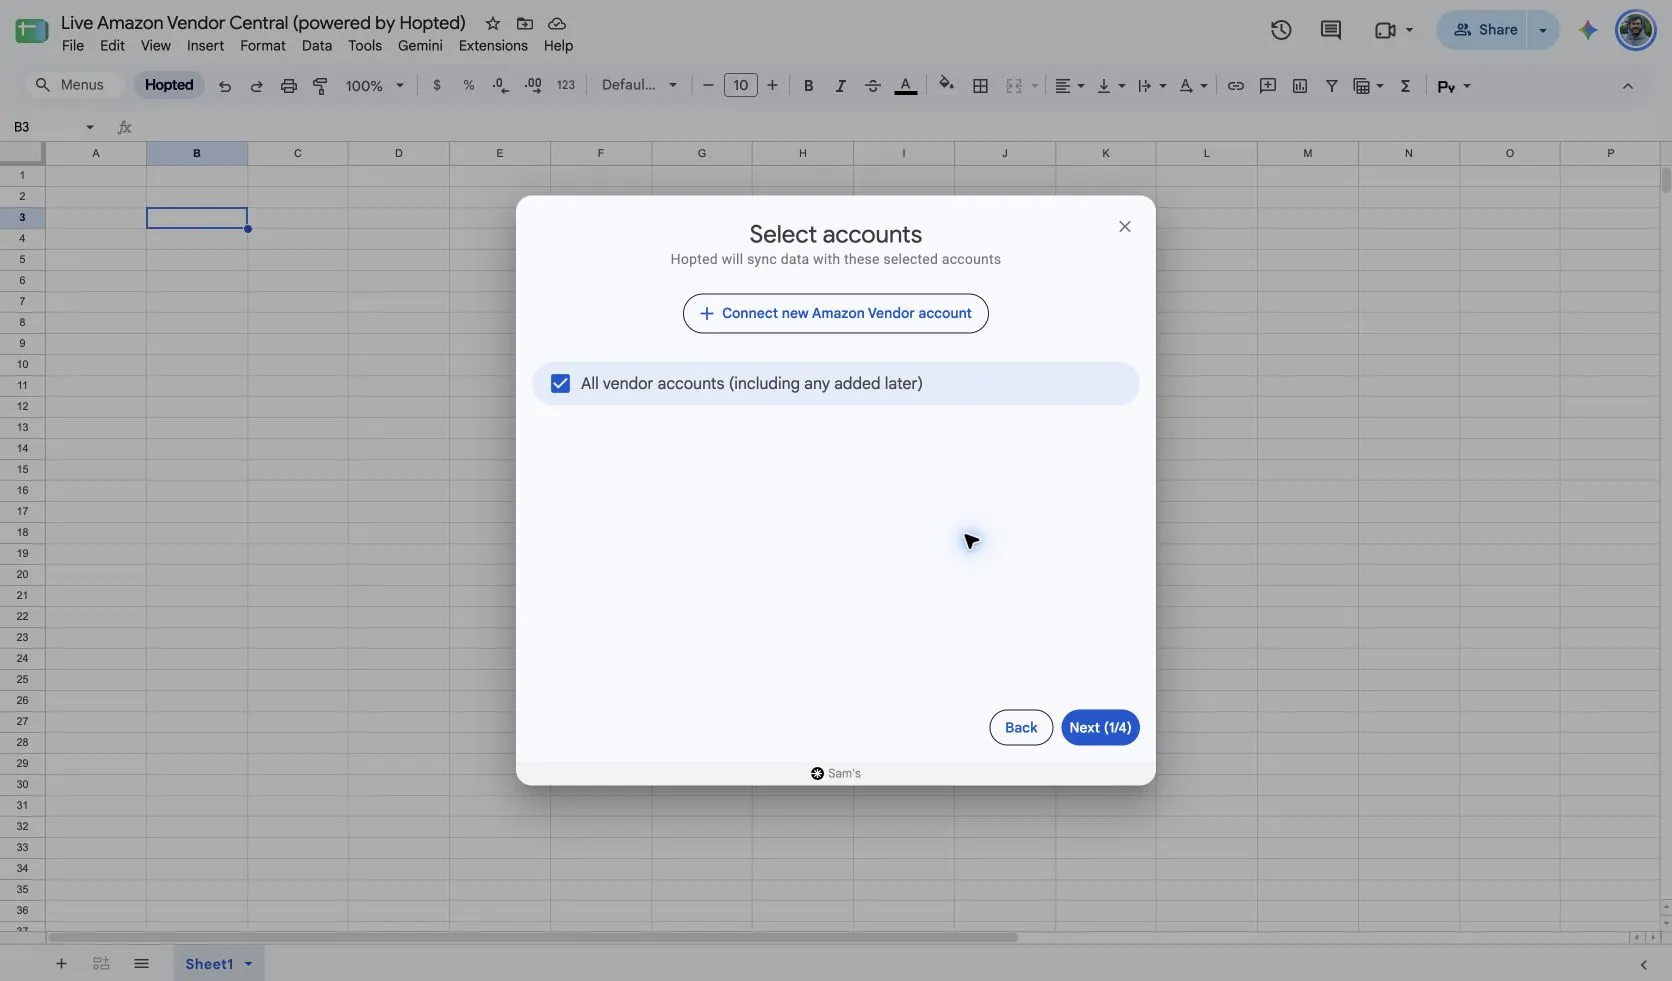
Install Hopted and sign in. Open your Google Sheet, click Hopted, then Add new data sync and Amazon Vendor Central. Select the vendor accounts to include. For a combined view, choose All vendor accounts (including any added later).
2. Choose the source, settings, and columns
Choose Vendor Net Pure Product Margin in the source list and use Add beside the fields you need. Review the source settings where present. The screenshot below shows this source in the current Hopted picker.
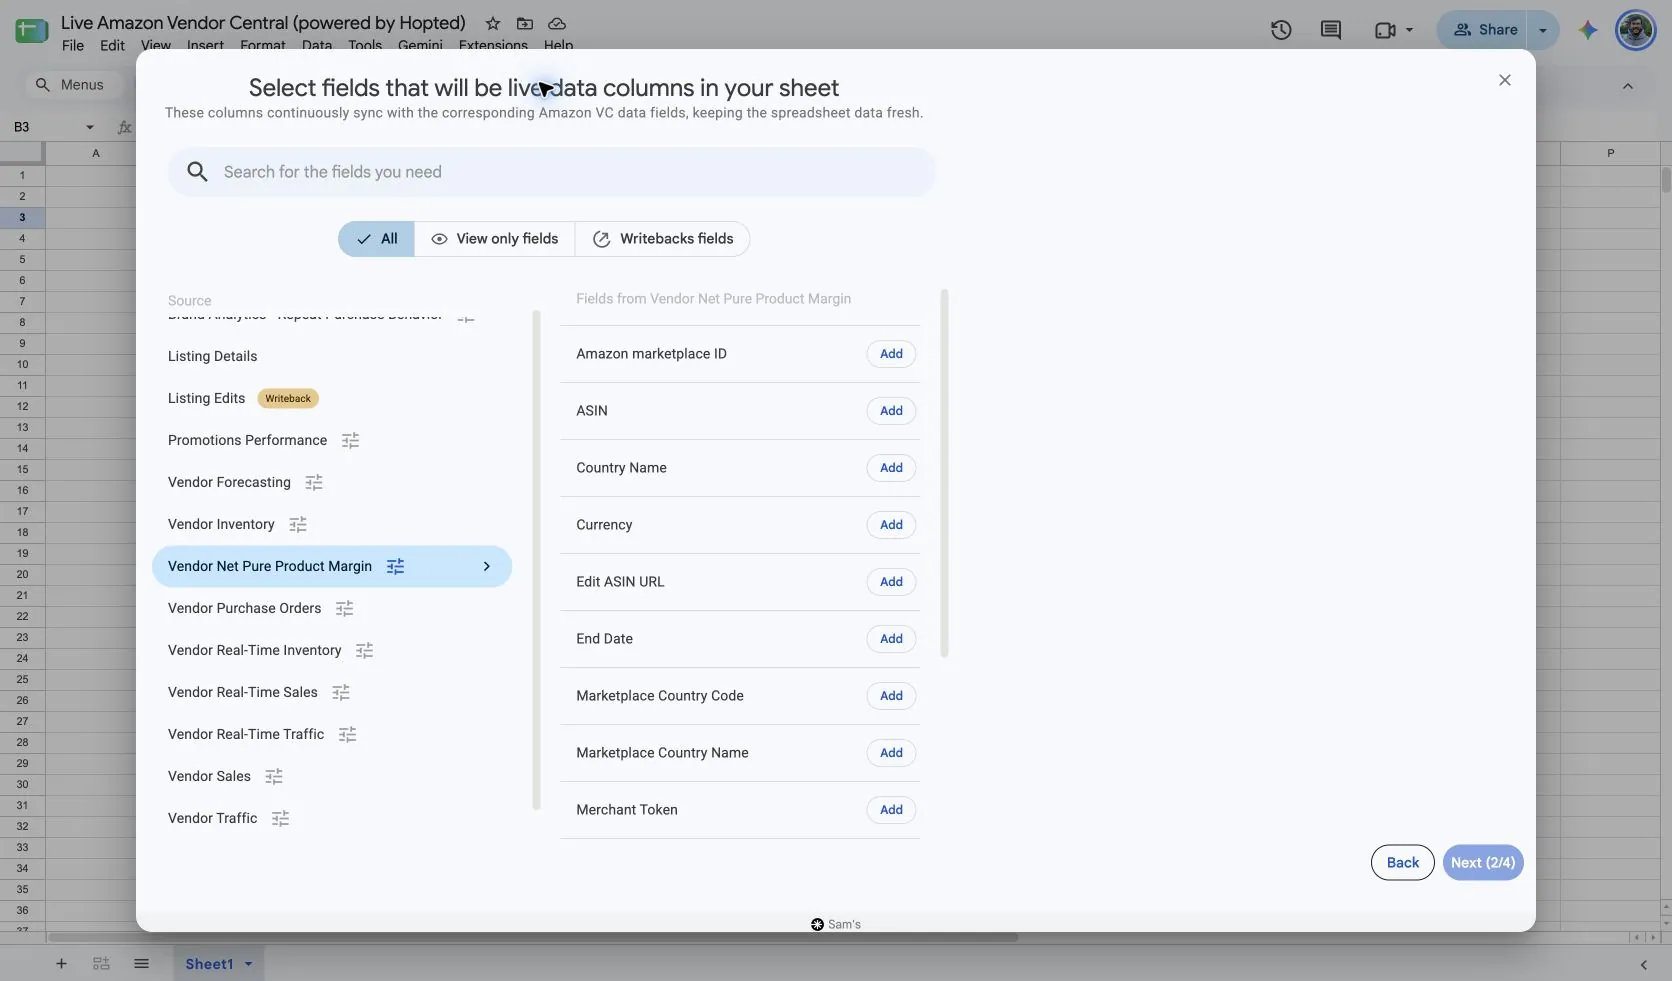
Select Vendor Net Pure Product Margin in Hopted. Use Include records from: Previous calendar month and Reporting period: Month for a consistent starting point. Keep the same date scope when you bring in Vendor Sales.
Use supported Day, Week, or Month periods to match the decision you are making. Weekly and monthly selections need completed calendar periods. This source has no Distributor view or Selling program selector in the captured Hopted picker.
In Google Sheets, format Net Pure Product Margin as a percentage if you want familiar percentage display. A raw value of 0.3037 means 30.37%. Do not multiply a fraction by 100 and also apply percentage formatting.
3. Review optional filters
Leave filters unset for a broader import, or add a filter for the specific records you want to review. Check account, date-range, and filter choices when an expected result is missing.
4. Choose a refresh schedule
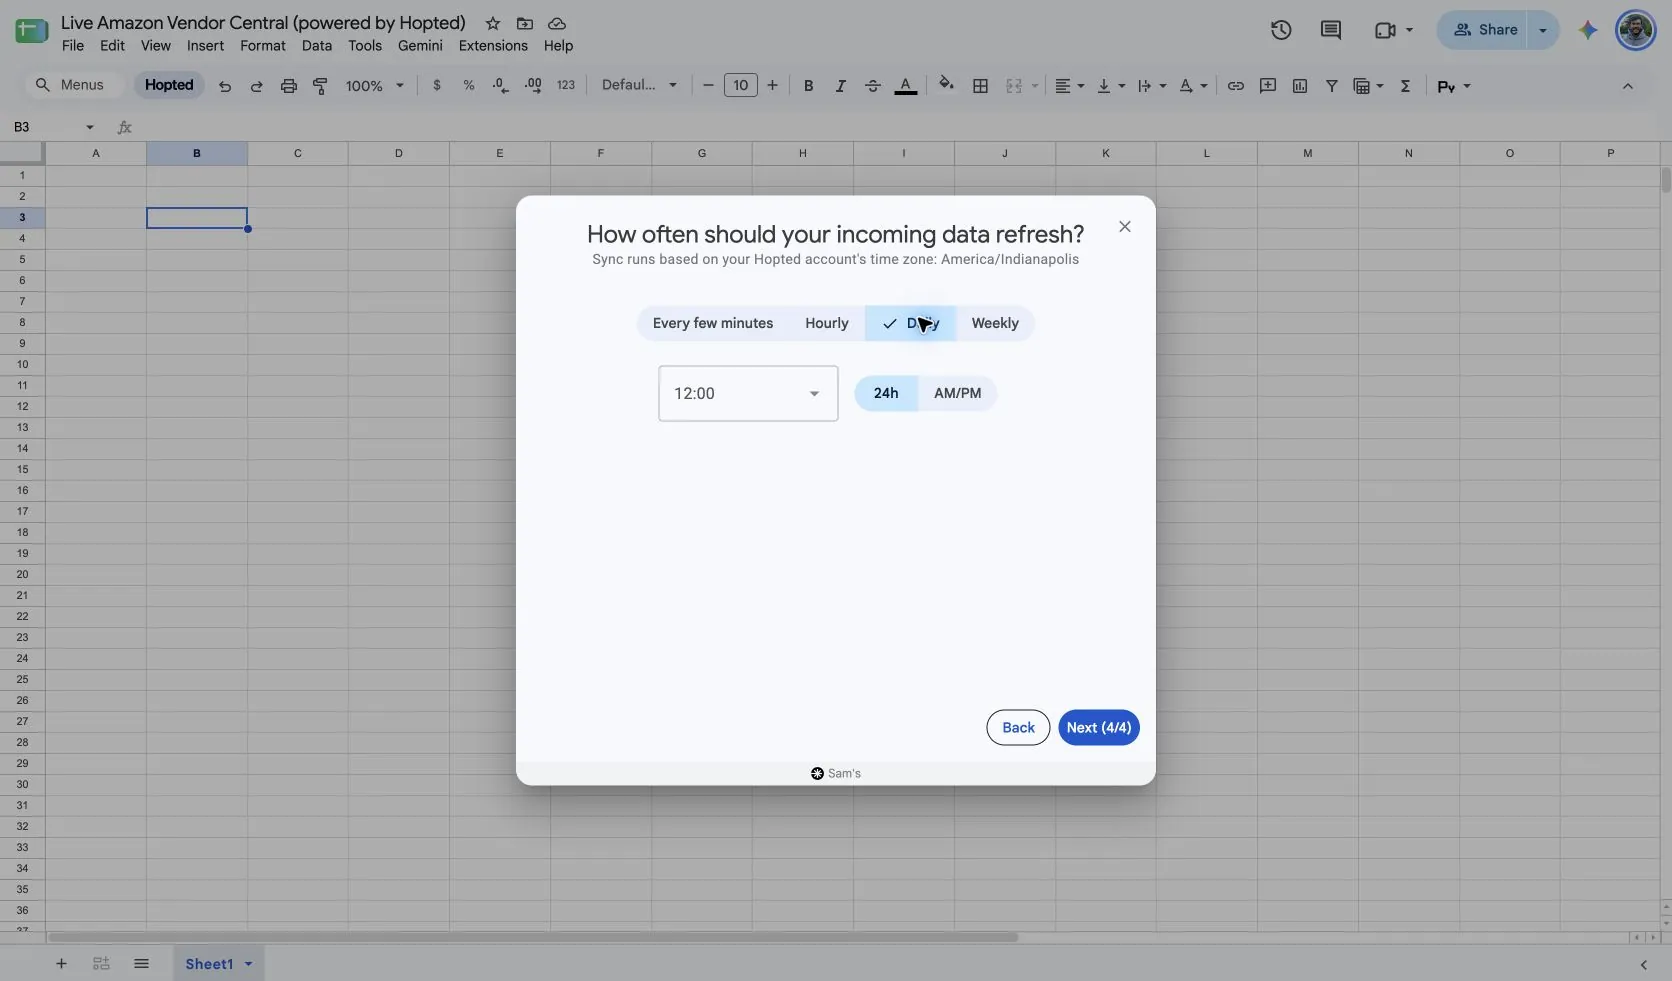
Hopted offers every-few-minutes, hourly, daily, and weekly schedules. The schedule uses the time zone shown for your Hopted account. Choose a cadence that fits the report and your review; a faster schedule cannot make Amazon publish data sooner.
5. Review and create the Sync
Check the accounts, selected fields, source settings, filters, and refresh schedule. Choose Create new Sync when the configuration is ready. Review the imported rows before adding calculations or sharing a dashboard.
How to use the report
- Compare an ASIN’s margin over matching completed periods. Flag substantial changes for review with the relevant commercial owner, keeping the original Amazon value visible next to any commentary or target.
- Combine Net PPM with Vendor Sales using ASIN, marketplace, and matching dates. This helps you distinguish a high-revenue product with a weaker margin from a lower-revenue product with a stronger margin. It supports prioritization, rather than proving the cause of the difference.
- Prepare a product review that keeps Amazon’s margin separate from your own costs and profitability. Add your approved internal cost assumptions in separate columns, so readers can see which figures came from Amazon and which belong to your business.
What to check before comparing results
Amazon defines Net PPM as (Product Revenue minus Product COGS minus Vendor Funded Coop) divided by Product Revenue. The measure reflects Amazon’s perspective. It should not be relabeled as the vendor’s gross margin or used as a complete account profit-and-loss statement.
Do not add product margins together. A simple average of ASIN percentages may differ from Amazon’s catalog aggregate because products have different revenue weights. Use matching periods and marketplaces, and preserve Amazon’s reported aggregate when you need a catalog figure.
The report follows standard Vendor analytics publication timing and Amazon’s documented PST convention. A scheduled refresh retrieves data that is available; it does not guarantee a final result for a recent period.
Availability depends on the vendor account, marketplace, permissions, and the data Amazon supplies. Keep row dimensions intact when joining reports. For longer-term comparisons, review Hopted Data history.
Questions and answers
How do I export Vendor Net Pure Product Margin to Google Sheets?
Open Hopted in Google Sheets, choose Amazon Vendor Central, select your vendor accounts, and choose Vendor Net Pure Product Margin. Add the columns you need, review its settings and optional filters, then choose a refresh schedule and create the Sync.
Does Net PPM show my company’s profit?
No. It measures Amazon’s profitability from your products. Your own profit calculation needs your costs, terms, and other relevant business expenses.
Why does 0.25 appear instead of 25%?
The report value is a fraction. Formatting 0.25 as a percentage in Google Sheets displays 25%.
Sources and verification
Source names, example fields, and setup screens were checked in Hopted’s Vendor Central picker on October 14, 2026. Screenshots come from the supplied “Live Amazon Vendor Central (powered by Hopted)” Google Sheet.
See the Amazon Vendor Central connector for the connection overview, or return to the Vendor Central reports directory.