Brand Analytics - Repeat Purchase Behavior: export and sync to Google Sheets
Compare repeat customers and repeat purchase revenue by ASIN and reporting period.
What this report tells you
A strong sales month does not tell you whether customers came back. The Repeat Purchase Behavior source brings product-level repeat customer and revenue measures into Google Sheets, where you can compare established products, replenishable items, and newer launches. Use it to find products worth investigating, then combine the findings with your wider sales and inventory review.
Useful columns to start with
Choose a focused set of columns for your task. These are examples from Hopted’s current Vendor picker, rather than an exhaustive field list.
- ASIN — Keep each product identifiable when you join the report to sales or listing details.
- Start Date — Label the beginning of the reporting period instead of relying on the refresh date.
- End Date — Separate completed reporting periods and avoid comparing windows of different lengths.
- Orders — Read order volume alongside repeat behavior; an order may contain multiple units.
- Unique Customers — Add customer-count context before judging a percentage from a small audience.
- Repeat Customers % of Total — Compare the share of customers who purchased again for the reported ASIN.
- Repeat Purchase Revenue — Review the revenue contribution from repeat customers, retaining its Currency column.
- Repeat Purchase Revenue % of Total — See how much of the product revenue comes from repeat customers.
Keep Store name, marketplace, date or time fields, and Currency where available. This context helps keep different accounts, periods, and monetary amounts distinct.
How to export Brand Analytics - Repeat Purchase Behavior to Google Sheets
1. Connect Amazon Vendor Central to Google Sheets
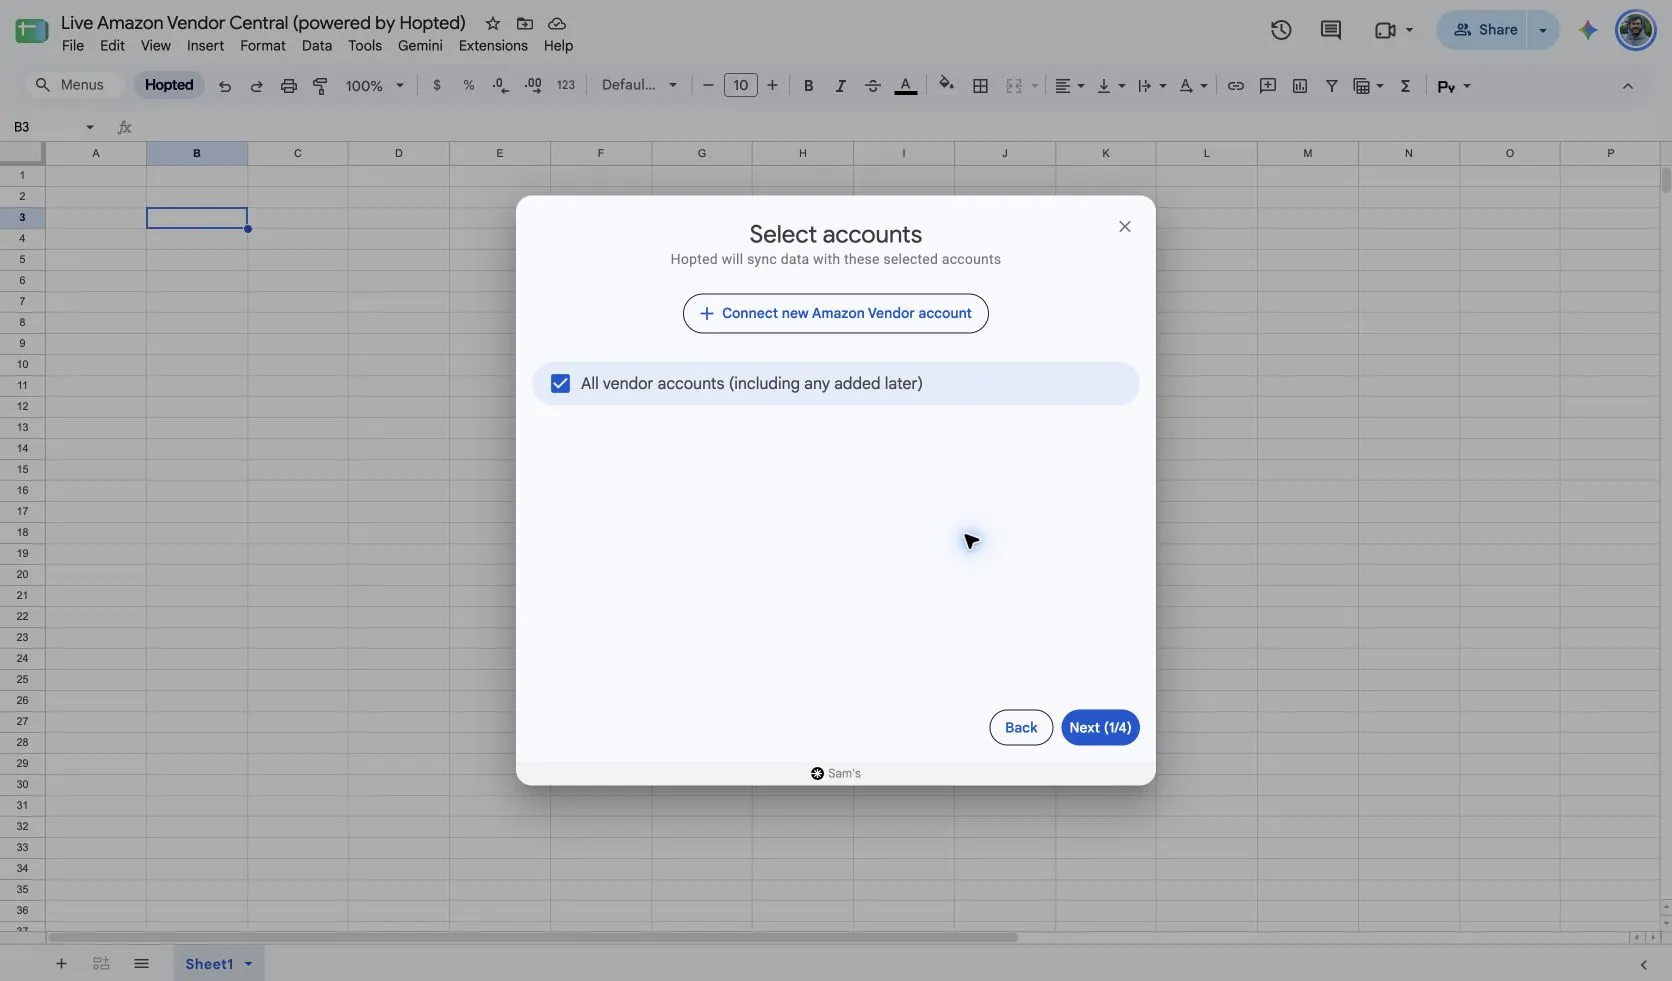
Install Hopted and sign in. Open your Google Sheet, click Hopted, then Add new data sync and Amazon Vendor Central. Select the vendor accounts to include. For a combined view, choose All vendor accounts (including any added later).
2. Choose the source, settings, and columns
Choose Brand Analytics - Repeat Purchase Behavior in the source list and use Add beside the fields you need. Review the source settings where present. The screenshot below shows this source in the current Hopted picker.
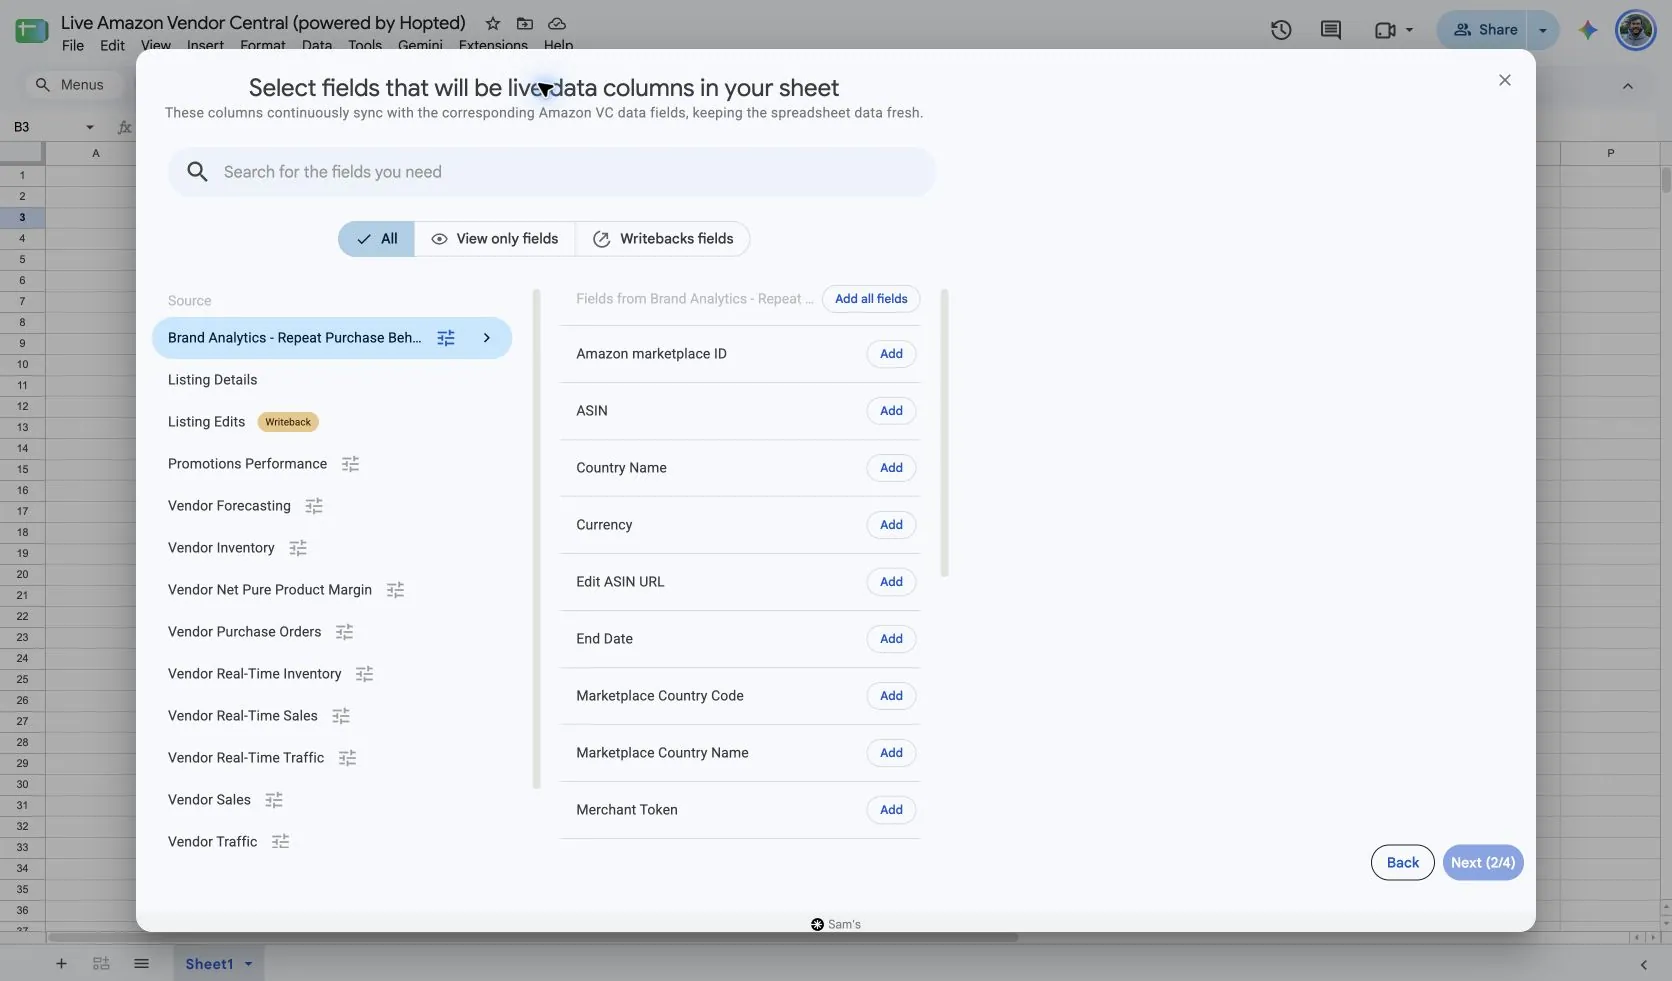
The verified Hopted setup shows Include records from set to Previous calendar month and Reporting period set to Month. Start with that completed period for a monthly review, then use another supported period when it answers a specific question.
Hopted supports Week and Month for this report. Use complete calendar periods; weekly boundaries are Sunday through Saturday. Keep Start Date and End Date in the sheet even when you change the selected columns.
3. Review optional filters
Leave filters unset for a broader import, or add a filter for the specific records you want to review. Check account, date-range, and filter choices when an expected result is missing.
4. Choose a refresh schedule
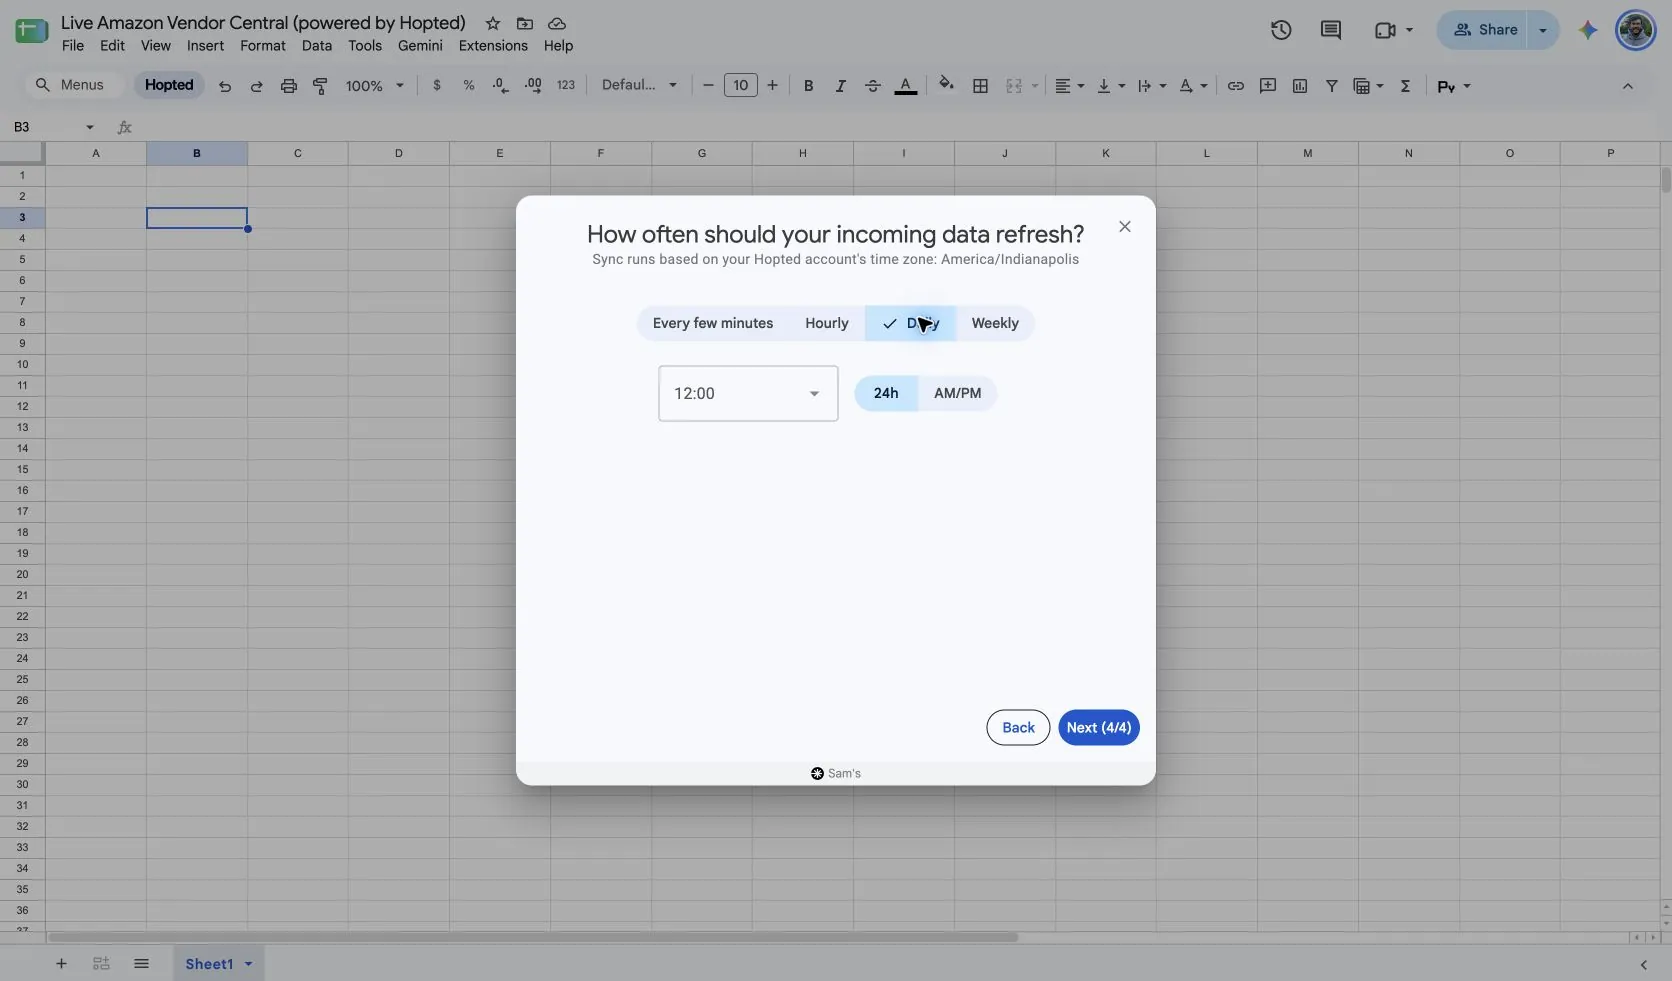
Hopted offers every-few-minutes, hourly, daily, and weekly schedules. The schedule uses the time zone shown for your Hopted account. Choose a cadence that fits the report and your review; a faster schedule cannot make Amazon publish data sooner.
5. Review and create the Sync
Check the accounts, selected fields, source settings, filters, and refresh schedule. Choose Create new Sync when the configuration is ready. Review the imported rows before adding calculations or sharing a dashboard.
How to use the report
- Compare similar products over the same month. Sort by Repeat Customers % of Total, then check Unique Customers and Orders before choosing which products deserve a closer review. A high percentage on a tiny customer base needs context.
- Build a repeat-revenue review by ASIN and Currency. Compare the revenue share with the customer share, and record a short explanation beside unusual changes: a launch, stock interruption, pack-size change, or seasonal buying pattern.
- Join ASINs to Listing Details for readable names, and to Vendor Sales for sales context. Keep the periods aligned. Review the combined sheet with the team before choosing a replenishment or retention experiment.
What to check before comparing results
These are aggregated product measures, not a customer contact list or a lifetime retention cohort. Repeat Purchase Revenue is ordered revenue and does not reflect returns. Do not add unique customers across ASINs or average percentages to claim an account-wide repeat rate; the same person may buy several products.
Availability depends on the vendor account, marketplace, permissions, and the data Amazon supplies. Keep row dimensions intact when joining reports. For longer-term comparisons, review Hopted Data history.
Questions and answers
How do I export Brand Analytics - Repeat Purchase Behavior to Google Sheets?
Open Hopted in Google Sheets, choose Amazon Vendor Central, select your vendor accounts, and choose Brand Analytics - Repeat Purchase Behavior. Add the columns you need, review its settings and optional filters, then choose a refresh schedule and create the Sync.
Are Orders the same as units ordered?
No. An order can include more than one unit. Use Orders as an order count, and use Vendor Sales when you need unit measures.
Can I compare two months?
Yes. Keep each period clearly labeled and compare the same ASINs, marketplace, and currency. Review customer counts alongside percentage changes.
Does a higher repeat share prove a promotion worked?
No. The report shows a pattern, not its cause. Use promotion timing and other business context to decide what to investigate.
Sources and verification
Source names, example fields, and setup screens were checked in Hopted’s Vendor Central picker on October 14, 2026. Screenshots come from the supplied “Live Amazon Vendor Central (powered by Hopted)” Google Sheet.
See the Amazon Vendor Central connector for the connection overview, or return to the Vendor Central reports directory.