Vendor Forecasting: export and sync to Google Sheets
Use Amazon’s mean and percentile demand forecasts to support production and inventory planning.
What this report tells you
Vendor Forecasting provides Amazon’s latest demand forecast for your products. In Google Sheets, you can compare mean and percentile forecasts with your own supply, production, and lead-time assumptions. The report helps frame planning scenarios, but it is not an order from Amazon and does not promise that a forecast quantity will be purchased. Keep forecasts and confirmed purchase orders visible as separate inputs.
Useful columns to start with
Choose a focused set of columns for your task. These are examples from Hopted’s current Vendor picker, rather than an exhaustive field list.
- ASIN — Identify the product covered by the forecast.
- StartDate — Keep the beginning of the forecasted time period visible.
- EndDate — Keep the end of the forecasted time period visible.
- Mean Forecast Units — Review Amazon’s average predicted demand for the period.
- P70 Forecast Units — Compare a lower percentile planning scenario.
- P80 Forecast Units — Review the quantity at the 80th percentile of forecast demand.
- P90 Forecast Units — Explore a higher percentile scenario alongside carrying-cost assumptions.
Keep Store name, marketplace, date or time fields, and Currency where available. This context helps keep different accounts, periods, and monetary amounts distinct.
How to export Vendor Forecasting to Google Sheets
1. Connect Amazon Vendor Central to Google Sheets
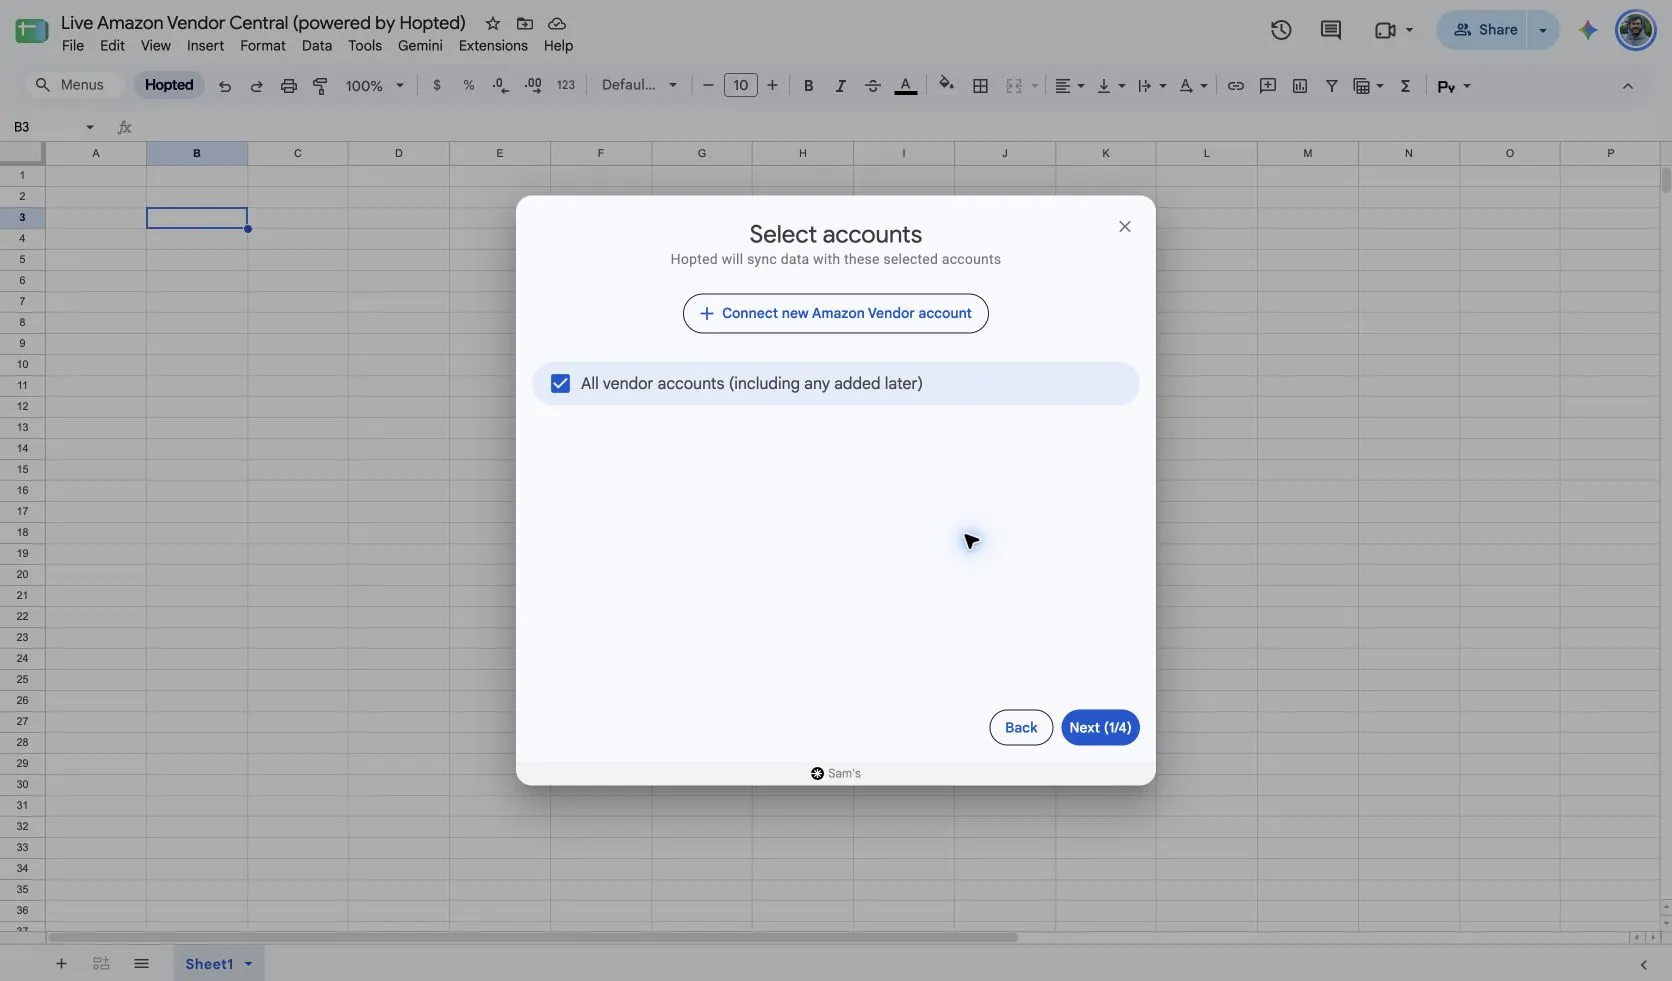
Install Hopted and sign in. Open your Google Sheet, click Hopted, then Add new data sync and Amazon Vendor Central. Select the vendor accounts to include. For a combined view, choose All vendor accounts (including any added later).
2. Choose the source, settings, and columns
Choose Vendor Forecasting in the source list and use Add beside the fields you need. Review the source settings where present. The screenshot below shows this source in the current Hopted picker.
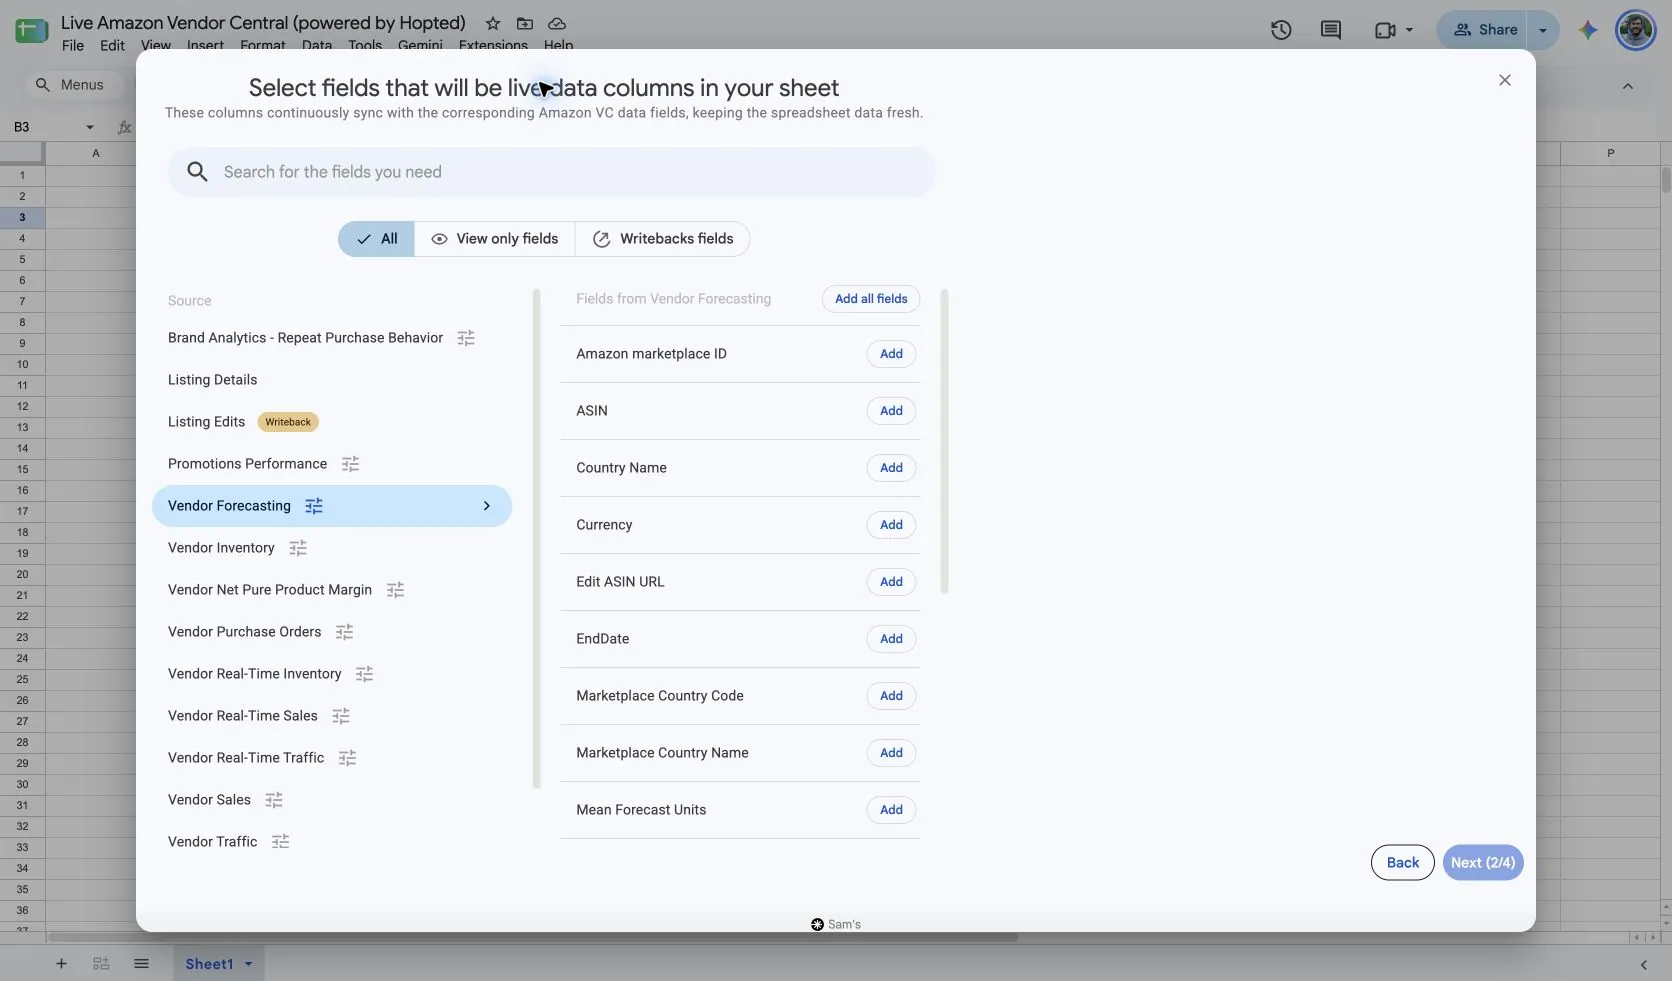
Select Vendor Forecasting in Hopted and choose Selling program to match your business. The captured default is Retail; other programs require relevant data in the connected account.
This source supplies the latest forecast and does not have the standard Include records from or Reporting period selectors. StartDate and EndDate describe the future period being forecasted, not the date when you ran the sync.
Keep ASIN and both forecast dates in your columns. This preserves the time horizon needed to compare the forecast with production plans or expected replenishment.
3. Review optional filters
Leave filters unset for a broader import, or add a filter for the specific records you want to review. Check account, date-range, and filter choices when an expected result is missing.
4. Choose a refresh schedule
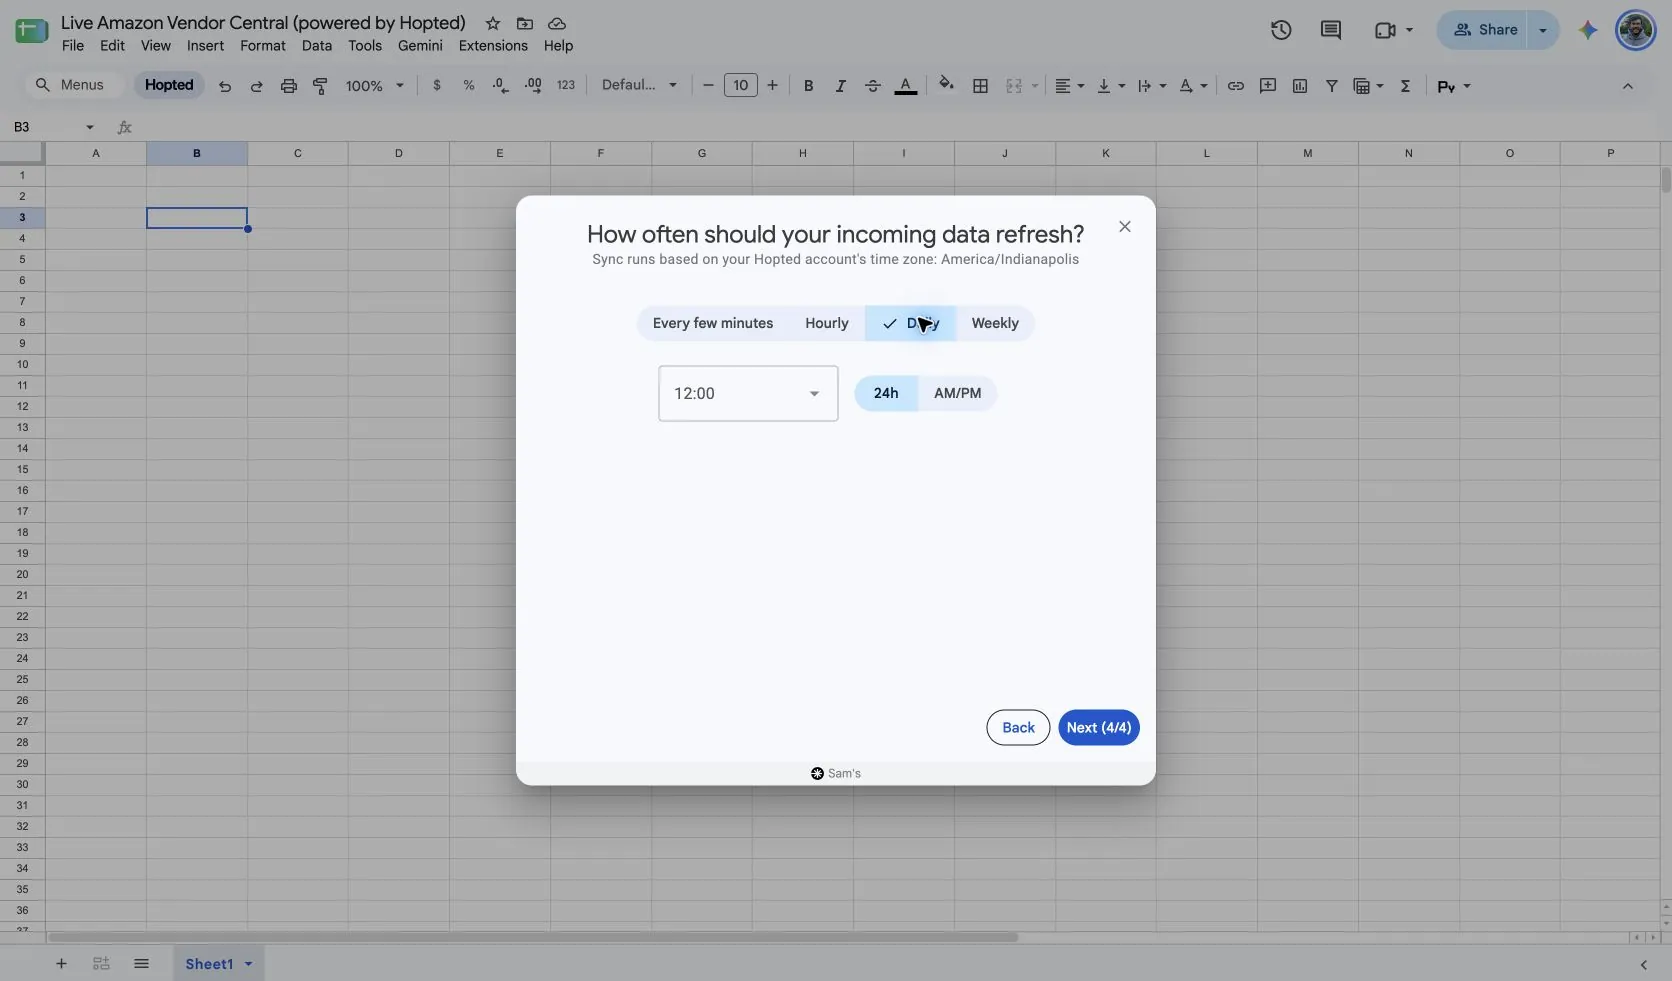
Hopted offers every-few-minutes, hourly, daily, and weekly schedules. The schedule uses the time zone shown for your Hopted account. Choose a cadence that fits the report and your review; a faster schedule cannot make Amazon publish data sooner.
5. Review and create the Sync
Check the accounts, selected fields, source settings, filters, and refresh schedule. Choose Create new Sync when the configuration is ready. Review the imported rows before adding calculations or sharing a dashboard.
How to use the report
- Build a weekly planning view that lists each ASIN, forecast period, and mean/P80/P90 quantities. Compare the scenarios with your usable stock and supply plan. Use the result as a discussion input rather than automatically issuing a production commitment.
- Review forecast demand alongside Vendor Inventory and your own lead time. Identify products where supply assumptions appear insufficient for the selected scenario, then inspect open purchase orders and delivery plans before deciding what action is needed.
- Compare a forecast with actual Vendor Sales only after the matching forecast period has closed. Preserve a dated copy of the forecast outside the live sync if you want to evaluate successive forecasts; a refresh can replace the latest forecast with a newer one.
What to check before comparing results
A percentile is a probability-based demand estimate. P80 means an estimated 80% probability that demand will remain at or below that quantity. It does not mean 80% growth, an 80% margin, or 80% of the mean forecast.
Amazon returns the latest forecast, rather than a selectable archive of previous forecast versions. The Hopted picker exposes forecast period dates but not a forecast-generation-date column. Record your snapshot date separately when comparing forecast versions.
Forecasts are not purchase-order commitments. Higher percentile quantities can reduce the risk of insufficient stock in a planning scenario while increasing excess-stock exposure. Apply your own service-level, lead-time, and carrying-cost assumptions.
Availability depends on the vendor account, marketplace, permissions, and the data Amazon supplies. Keep row dimensions intact when joining reports. For longer-term comparisons, review Hopted Data history.
Questions and answers
How do I export Vendor Forecasting to Google Sheets?
Open Hopted in Google Sheets, choose Amazon Vendor Central, select your vendor accounts, and choose Vendor Forecasting. Add the columns you need, review its settings and optional filters, then choose a refresh schedule and create the Sync.
Does the forecast tell me how much Amazon will order?
No. It predicts customer demand for planning. Use Vendor Purchase Orders for orders Amazon has actually placed.
What does P90 Forecast Units mean?
It is the 90th percentile of Amazon’s forecast demand: an estimated 90% probability that demand stays at or below that quantity for the period.
Sources and verification
Source names, example fields, and setup screens were checked in Hopted’s Vendor Central picker on October 14, 2026. Screenshots come from the supplied “Live Amazon Vendor Central (powered by Hopted)” Google Sheet.
See the Amazon Vendor Central connector for the connection overview, or return to the Vendor Central reports directory.