Brand Analytics - Market Basket Analysis: export and sync to Google Sheets
Find products purchased in the same customer order and compare purchased-together rank and combination share by ASIN.
What this report tells you
Market Basket Analysis connects your catalog ASINs with products customers bought in the same order. Use the pairings to explore complementary products and merchandising ideas. Each row describes an ASIN pair for a reporting period; it does not identify individual shoppers or explain why they bought together.
Start with one question: which complementary products regularly appear beside a core item? A focused monthly sheet can give product, merchandising, and commercial teams a shared list to investigate, while keeping the original ASIN pair and dates visible.
Useful columns to start with
- ASIN — Your catalog product being analyzed.
- Purchased with ASIN — The other product in the same order, which can be outside your catalog.
- Purchased with rank — Rank 1 is the most commonly purchased-together product.
- Combination share (%) — The pairing’s share of orders containing your ASIN and at least one different product. Apply Percentage formatting in Google Sheets.
- Period start and Period end — Keep each completed reporting period visible.
Retain account and marketplace context when comparing pairs or joining other reports. Do not join on your ASIN alone: a product can have several purchased-with ASINs in each period.
How to export Brand Analytics - Market Basket Analysis to Google Sheets
1. Connect Amazon Seller Central to Google Sheets
Install Hopted, sign in, and open your Google Sheet. Choose Add new data sync, then Amazon Seller Central and your connected accounts.
Select the seller accounts needed for this review. For a first check, use one account and marketplace so you can compare the result with the same Brand Analytics view in Amazon. Add a wider account selection once that context is clear.
2. Choose Market Basket Analysis and its columns
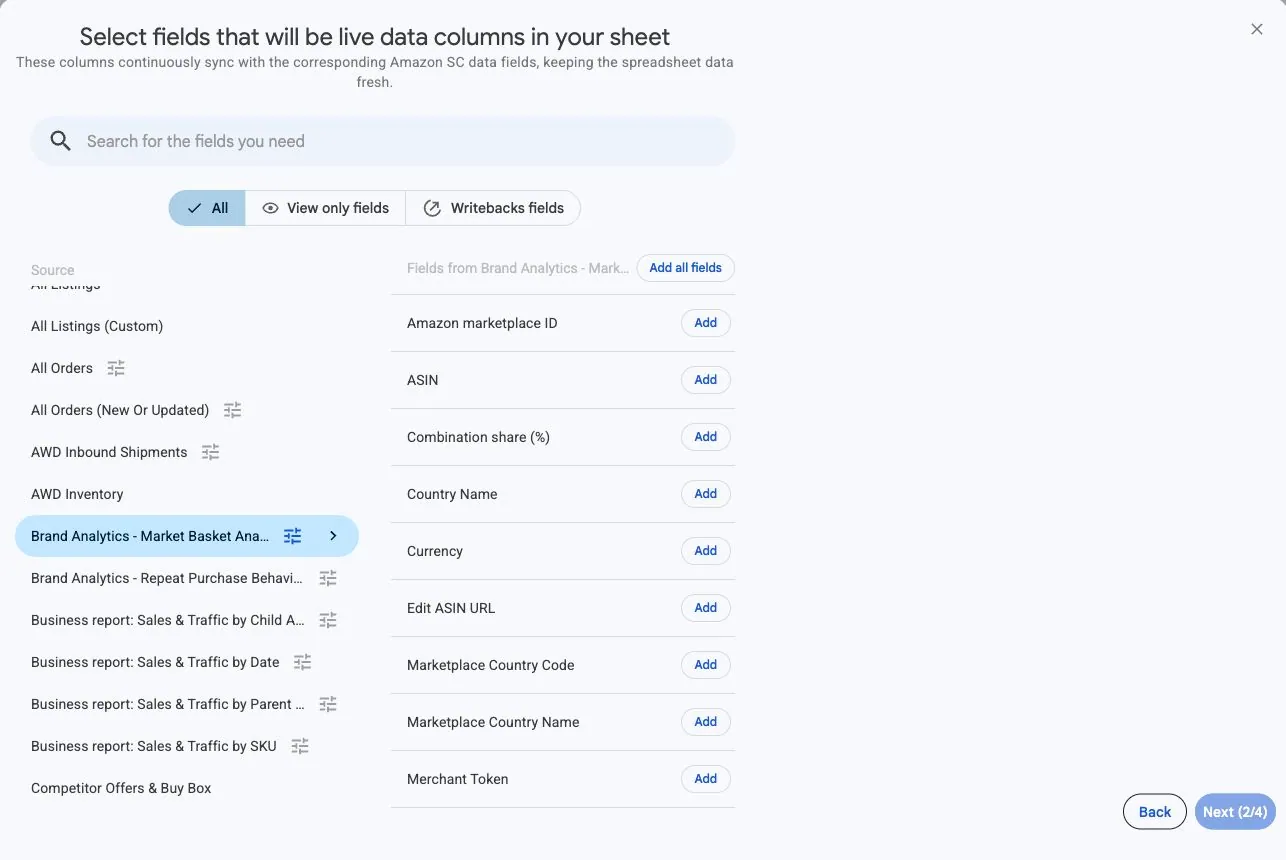
Choose Brand Analytics - Market Basket Analysis and add the columns you need.
Start with ASIN, Purchased with ASIN, Purchased with rank, Combination share (%), Period start, and Period end. Keep both ASINs: the first identifies your product, while the second identifies its purchased-together partner.
3. Select a completed reporting period
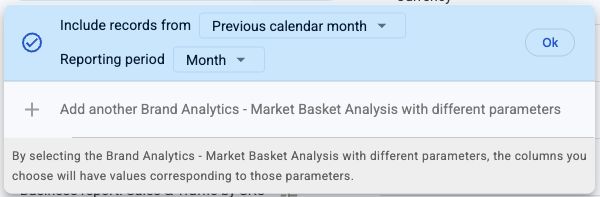
Set Include records from and Reporting period. Hopted supports Day, Week, and Month. Start with Previous calendar month and Month for a completed monthly review. Weeks run Sunday through Saturday; weekly and monthly selections must cover full past calendar periods.
For Day reporting, select a single completed calendar day. Hopted does not accept a multi-day range with Day; use Week or Month for longer reviews. Keep reporting dates within the previous two years and match the date range to the reporting period.
4. Review optional filters
Leave filters unset for an initial import, or narrow the records to a product you want to investigate. If an expected pairing is missing, review the source dates and filters before assuming buying behavior changed.
5. Choose a refresh schedule
Choose a refresh cadence that fits your review. A daily schedule can retrieve newly available data without requiring a manual download. The schedule does not change the reporting period or make Amazon publish the underlying report sooner.
6. Create the Sync and check the imported rows
Review the selected accounts, columns, source settings, optional filters, and schedule, then choose Create new Sync. Check a few rows for both ASINs and the expected period boundaries. Format Combination share (%) as Percentage before sharing the sheet. Several rows for your ASIN can be valid when the purchased-with product differs.
How to use the report
Compare the same ASIN pair across matching periods. Investigate recurring pairings for product education, cross-marketing, or bundle research, then check stock availability and commercial suitability. A pairing is an association; it does not prove that a campaign caused the purchase or that a bundle will sell.
Read the share using the right denominator
Suppose 100 orders contain your ASIN and at least one other product, and 12 contain a particular purchased-with ASIN. That pair has a 12% combination share, imported as 0.12. The denominator excludes orders containing only your product, so this does not mean 12% of all your orders or visitors.
Compare the same pair across periods
Filter to one ASIN pair and retain the marketplace and period dates. If its share moves from 8% to 12%, the change is 4 percentage points. Check the rank beside it, but do not infer a unit increase from share alone: the population of qualifying orders can also change.
Turn recurring pairs into a research list
Sort pairings by rank for a core product, then inspect the purchased-with items. Record whether they are complementary, already in your range, or supplied by another brand. Use the list to discuss product education or a merchandising experiment. Confirm availability and commercial suitability before choosing an action.
What to check before comparing results
Amazon makes this report available to eligible sellers and vendors registered in Amazon Brand Registry with Brand Analytics access. Availability also depends on your account and marketplace. A scheduled refresh retrieves the data Amazon has published; it cannot make an unfinished period available sooner.
Combination share uses multi-item orders as its denominator, so it is not your overall conversion rate. Keep ranks and shares at the ASIN-pair level; do not sum them across products to claim an account-wide rate.
Questions and answers
Is combination share the percentage of all orders?
No. Its denominator is orders containing your ASIN and at least one different product. Hopted imports a fraction: format 0.12 as Percentage to display 12%.
Does a purchased-together product have to be in my catalog?
No. The purchased-with ASIN may belong to another catalog. Review the product before treating the pairing as a bundling or cross-selling opportunity.
Why is an expected ASIN missing?
Check the connected account, marketplace, reporting dates, optional filters, and Brand Analytics access. Amazon supplies the available purchased-together pairings; the report does not guarantee a row for every catalog product. An absent row does not establish zero demand.
How does this differ from Repeat Purchase Behavior?
Market Basket Analysis describes products bought in the same order. Repeat Purchase Behavior describes customers buying your products again over time. Use the report that matches the question; neither provides a customer contact list.
Sources and verification
See the Amazon Seller Central connector or return to the Seller Central reports directory.