Standard Amazon inventory reports are "lite" versions of the truth. They show you stock and price, but they hide the critical backend settings that control your profitability. Where are your hidden B2B quantity discounts? Are your "Minimum Allowed Prices" actually set to prevent a repricer crash? What tax codes are assigned to your new SKU launch? The All Listings (Custom) Report is the deep-dive export that reveals the advanced attributes other reports leave out. This guide shows you how to stop guessing and start auditing. We'll cover how to automatically pull your Custom Listings report directly into Google Sheets to build a "Backend Configuration" dashboard.

How to Automatically Sync & Import the All Listings (Custom) Report to Google Sheets (The Hopted Way)
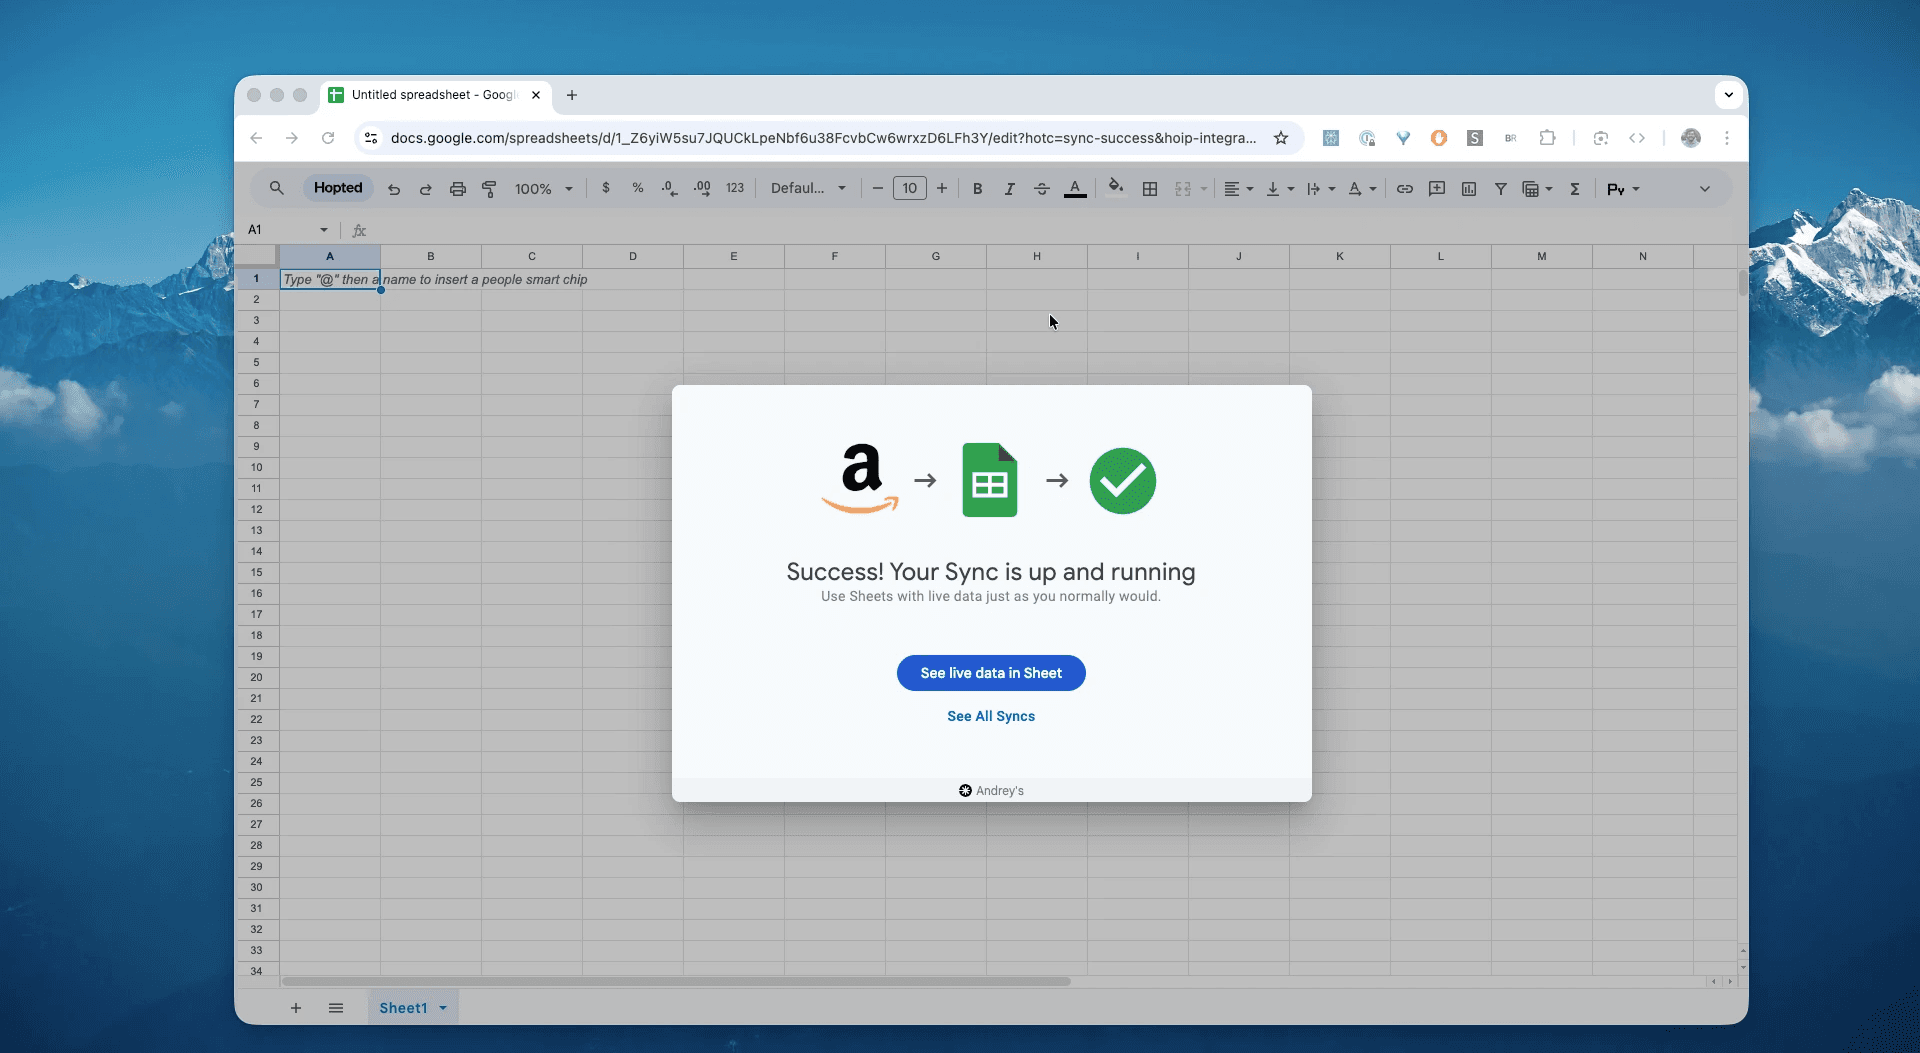
Using an Amazon to Google Sheets integration like Hopted, you set up the connection once, and your data flows automatically.
Step 1.
Install the Hopted browser extension and sign in using your Google Account.
Step 2.
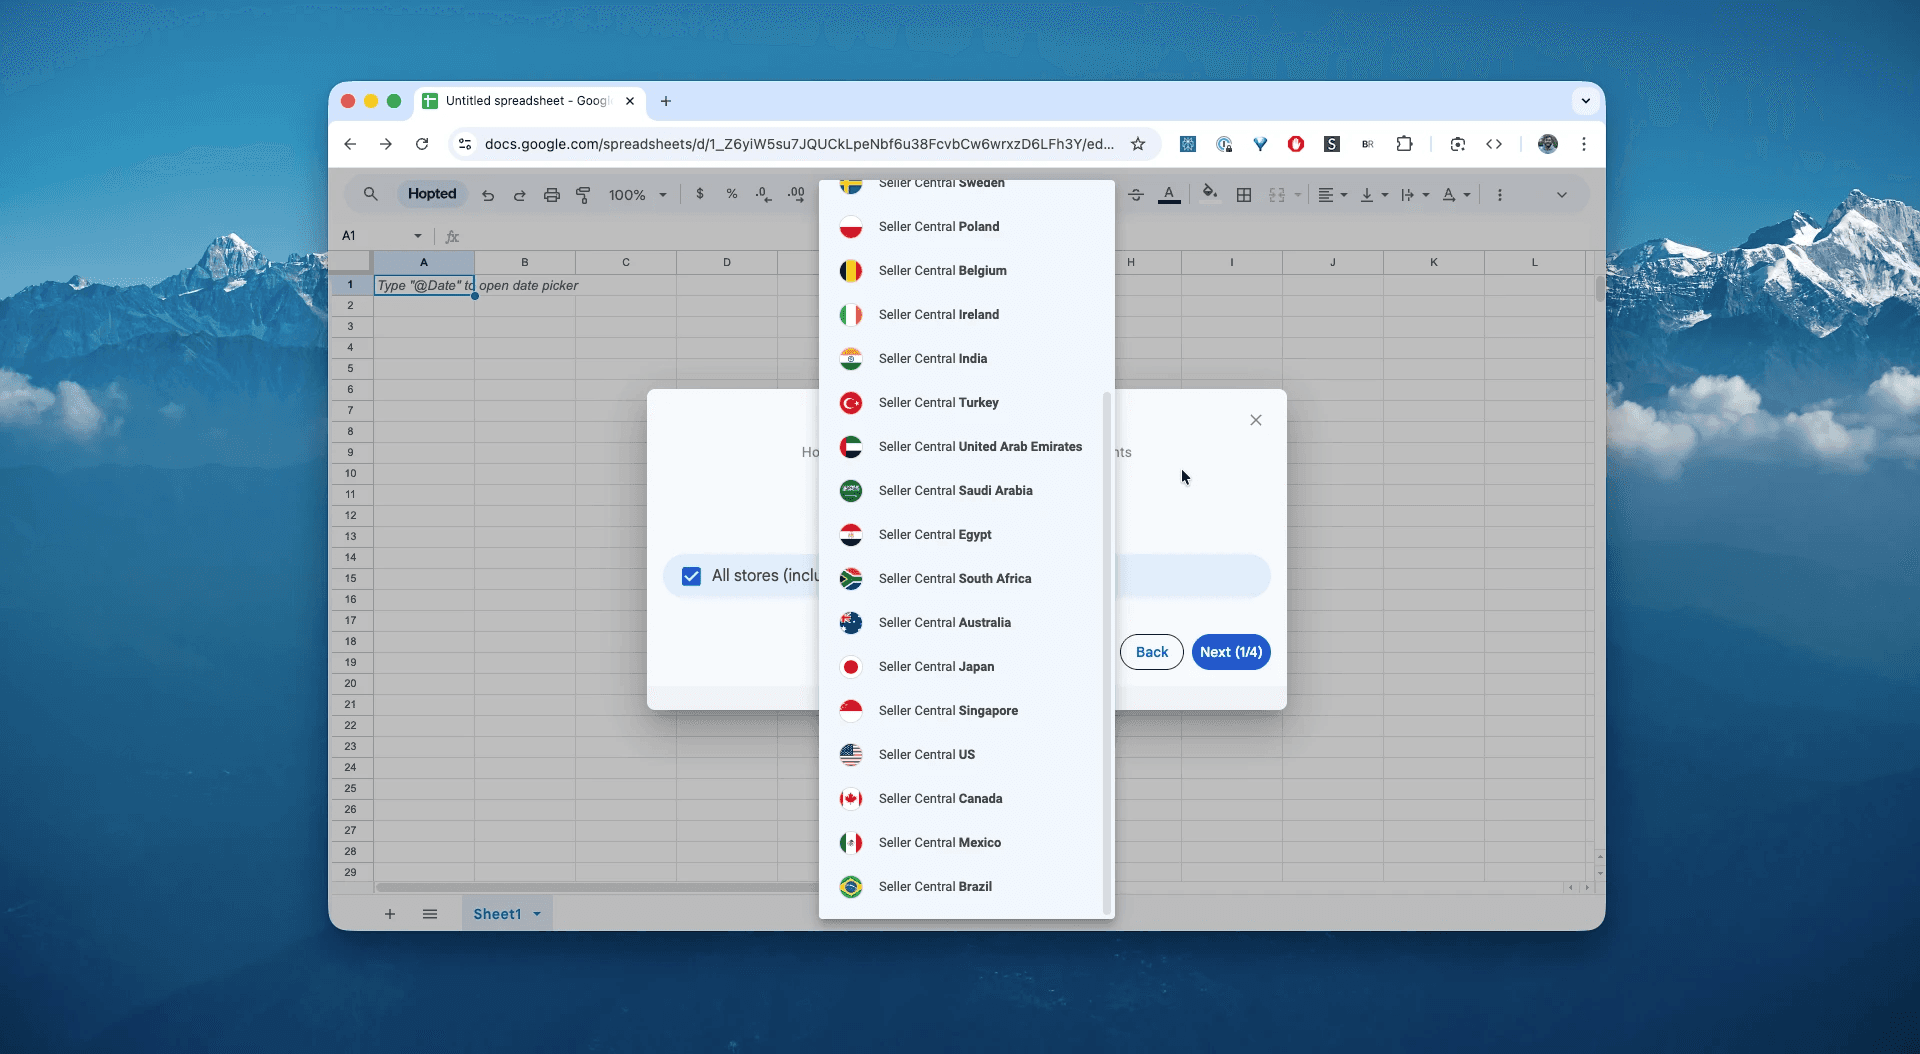
Securely connect your Amazon Seller Central to Google Sheets using Hopted's integration wizard.
Step 3.
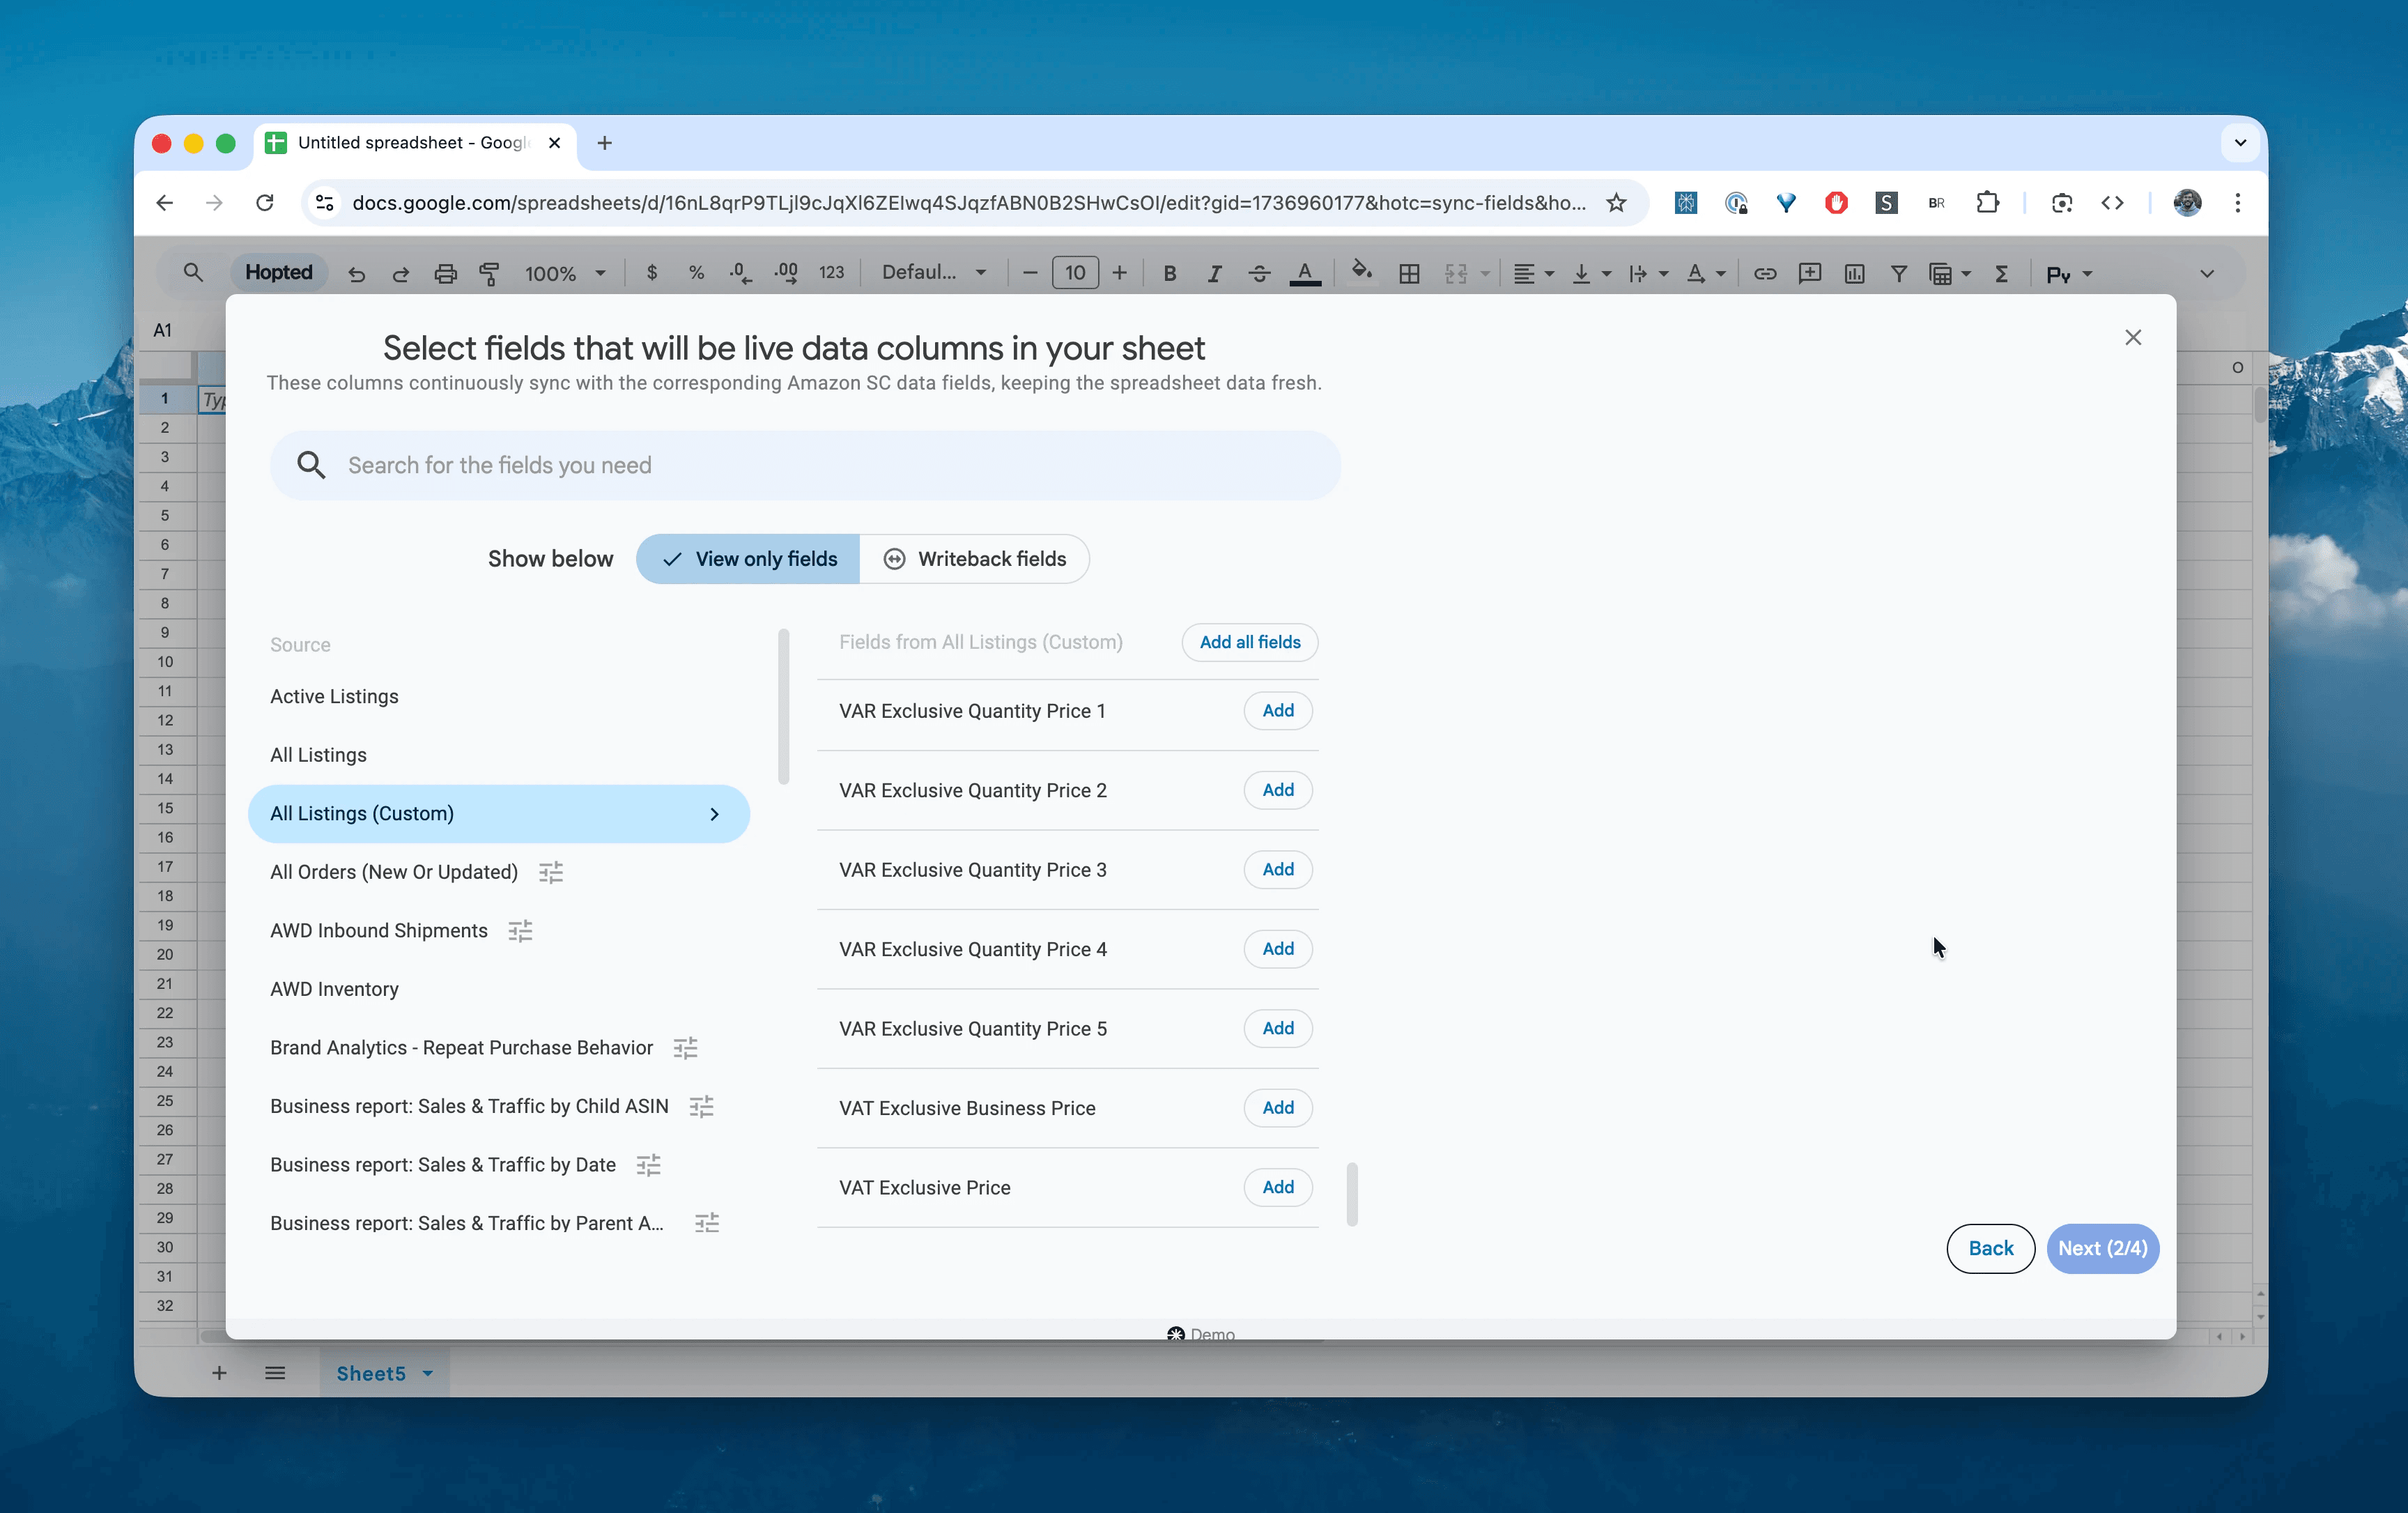
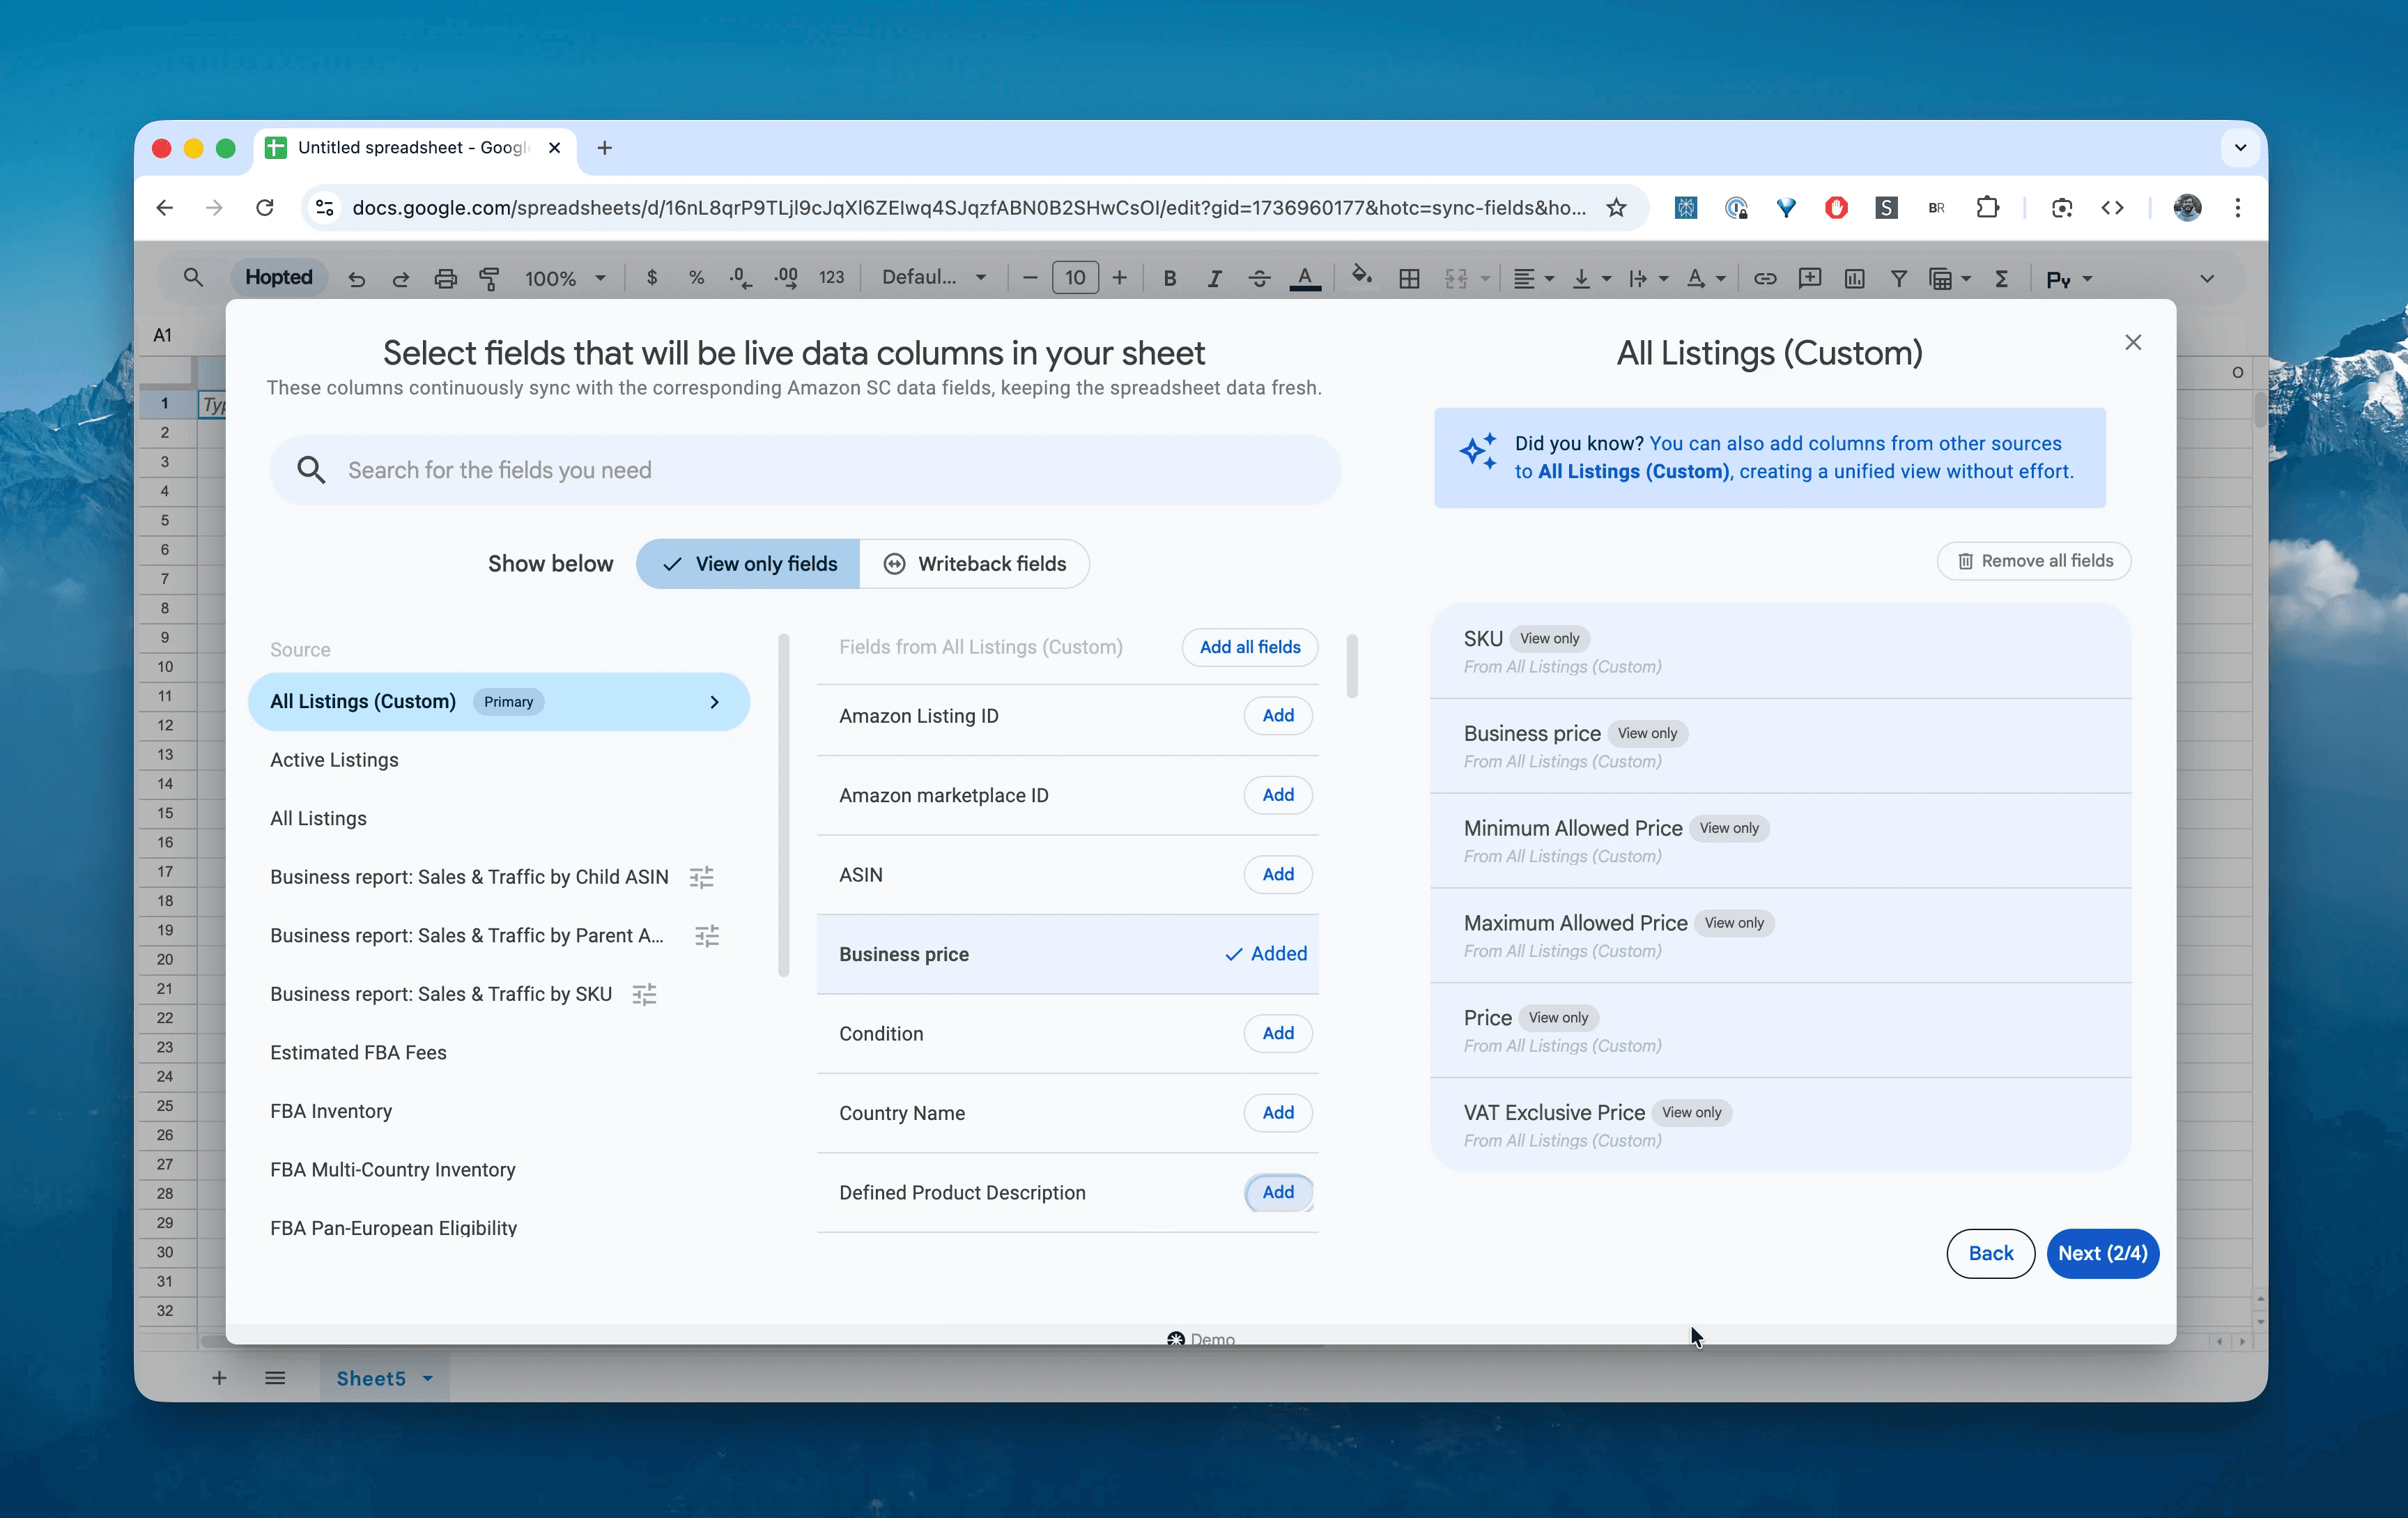
In Google Sheets, from the list of available Amazon Seller Central reports, select "All Listings (Custom)". This version unlocks the extended columns for B2B and compliance that aren't in the standard report.
Step 4.
Select the advanced columns you need: SKU, Business price, Quantity Price 1, Minimum Allowed Price, Product Tax Code, VAT Exclusive Price, and Progressive Price type.
Step 5.
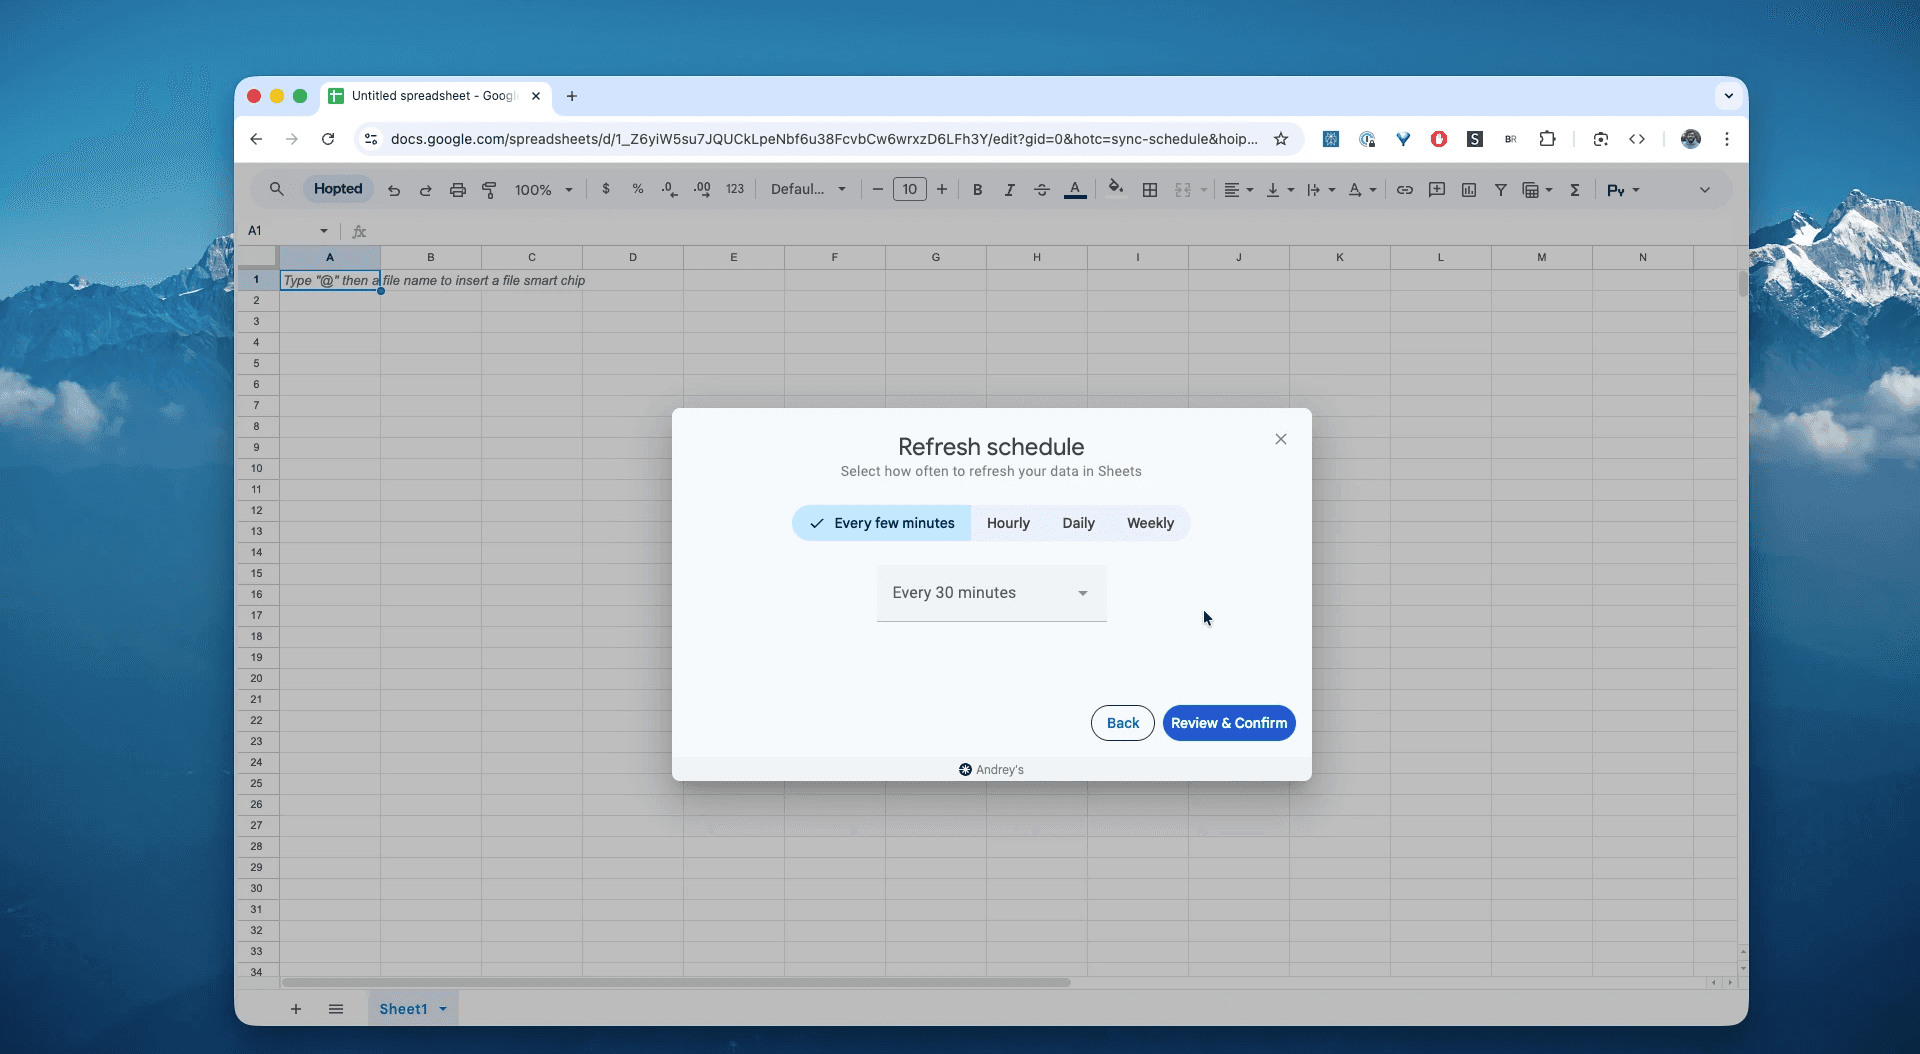
Set your schedule. Choose how often you want to export and refresh your backend settings. We recommend a Weeklyschedule for catalog audits, or Daily if you use an aggressive repricer.
Step 6.
Save your data pipeline. This will export your deep catalog data from Seller Central into spreadsheets automatically. Your configuration audit will be up to date forever.
What is the Amazon All Listings (Custom) Report?
Think of the standard "All Listings" report as the front of the store, and the All Listings (Custom) Report as the warehouse manager's clipboard. It contains the granular, technical details that determine how your product is sold, taxed, and discounted.
It is specifically designed for sellers who use Amazon Business (B2B), international sellers dealing with VAT, and automated sellers using Repricing Software.
This makes it the single source of truth for answering questions like:
Which products have a **Business Price** that is accidentally lower than my break-even?Are my **Minimum Allowed Prices** set correctly to stop my repricer from tanking my margin?Do I have the correct **Product Tax Code** assigned to my zero-rated food items?Which SKUs have **Quantity Discounts** (Tier 1-5) active for bulk buyers?Are my **VAT Exclusive Prices** calculated correctly for cross-border sales?
How to Analyze & Track Your Custom Catalog Data in Spreadsheets
Now that you have a live feed, you can move from data entry to data analysis. This is the real power of analyzing your Amazon Seller Central data in spreadsheets and building your Amazon excel-like template.
Here are 4 Amazon spreadsheet template ideas you can build immediately:
Template 1: The "B2B Discount" Auditor
If you sell on Amazon Business, you likely offer "Quantity Discounts" (e.g., 5% off if you buy 10+ units). It is easy to lose track of these margins.
How to build it:
Columns:
Price,Business Price,Quantity Price 1,Quantity Lower Bound 1.Formula: Calculate the discount depth:
=1 - (Quantity Price 1 / Price).What it shows you: Instant visibility into your bulk strategy. You might find you are offering a 20% discount on a low-margin item, effectively paying business customers to buy your stock.
Template 2: The "Repricer Safety" Net
Repricing software relies on the "Min" and "Max" prices you set in Amazon to know when to stop. If these are blank or wrong, you risk selling for pennies or getting deactivated for "High Pricing Errors."
How to build it:
Filter: Filter for rows where
Minimum Allowed Priceis empty ORMaximum Retail Priceis empty.Logic: Highlight rows where
Minimum Allowed Price< (Cost of Goods+FBA Fees).What it shows you: A list of dangerous SKUs. If your "Min Price" is lower than your cost, a repricer war could wipe out your profit in minutes. This report allows you to audit those guardrails daily.
Template 3: The "Tax Compliance" Shield
Using the wrong Tax Code (PTC) can lead to massive liabilities during a sales tax audit.
How to build it:
Pivot Table: Rows =
Product Tax Code. Values =Count of SKU.The Check: Group your products by category.
What it shows you: Anomalies. If you sell "Apparel" (usually taxable) but 5 SKUs are listed under "Groceries" (often tax-exempt), you have a compliance ticking time bomb. This report spots those misclassifications instantly.
Common workflows this report unlocks
Bulk Price Updates: Use the
Price,Business Price, andQuantity Pricecolumns to model your margins in Excel, then create a bulk upload file to update thousands of SKUs at once.International Expansion: Verify that your
Ship InternationallyandVAT Exclusive Pricesettings are correct before turning on European or Global selling.Liquidation Planning: Use
Sell remainderandPending quantitycolumns to identify exactly which stock is tied up in orders vs. available for removal orders.
FAQ about All Listings (Custom) Report
Q: What is the difference between "Standard" and "Custom" All Listings reports? The "Standard" report focuses on basic inventory data (SKU, Title, Price, Quantity). The "Custom" report adds advanced columns for B2B (Business Price, Quantity Discounts), Compliance (Tax Codes, Max/Min Prices), and International (VAT, Shipping Groups).
Q: Why do I need to check "Minimum Allowed Price"? Amazon uses this field to deactivate your listing if you price it too low (to prevent errors). If you don't set this, or set it too low, you have no safety net against a pricing glitch or an aggressive repricer.
Q: What is "Progressive Price"? This is a B2B feature. Instead of a fixed price for bulk orders, "Progressive Pricing" allows you to offer a discount on additional units. For example, the first unit is $10, but every unit after that is $9. This report lets you audit those complex tiers.
Q: Can I use this report to fix "High Pricing Errors"? Yes. Often, a "High Pricing Error" happens because your Maximum Retail Price is set too low (e.g., $20) while your selling price is higher ($25). Updating the Maximum Retail Pricecolumn using data from this report will reactivate those listings.
Q: How is Hopted different from other Amazon seller software? Most Amazon tools force you into their rigid dashboards and pre-built reports. You have to change your workflow to fit their software. With Hopted is the opposite. It’s a flexible data automation layer that works directly inside your existing spreadsheets (like Google Sheets). Instead of forcing you to learn a new system, Hopted brings all your scattered Amazon data (sales, inventory, orders, etc.) right to you. You can build the fully custom reports and automations you need, not the ones a rigid tool dictates.


Hopted,
explained.
Watch the film